Statistic reports will show you counts and sums. These reports are all about numbers and statistics, for reports that return more detailed data, use the Guided Report Wizard. These reports are limited in what data they can look at, so it's often recommended to use custom reports for official end of the year statistics.
Note
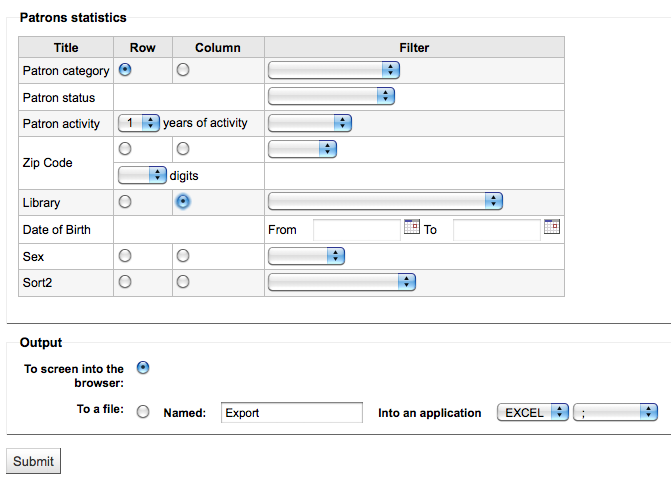
These reports are limited in what data they can look at, so it's often recommended to use custom reports for official end of the year statistics.
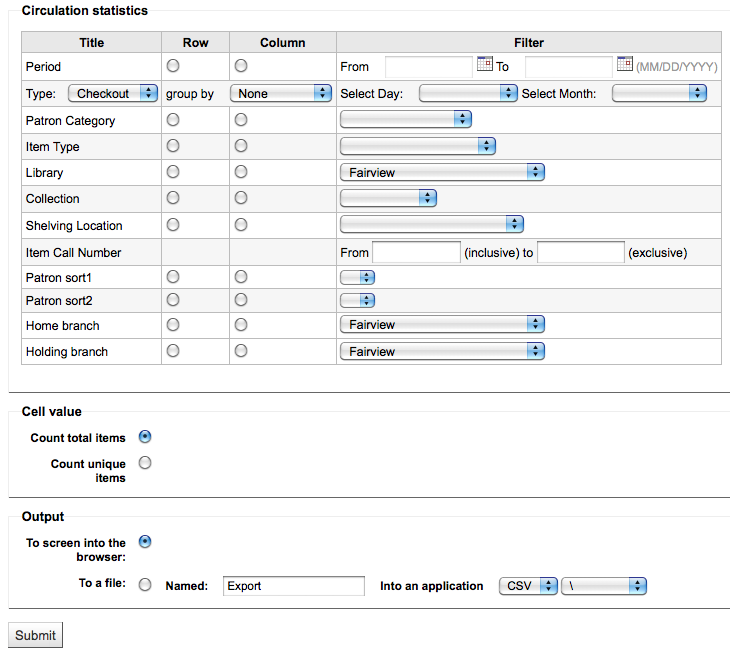
Using the form provided, choose which value you would like to appear in the Column and which will appear in the Row.
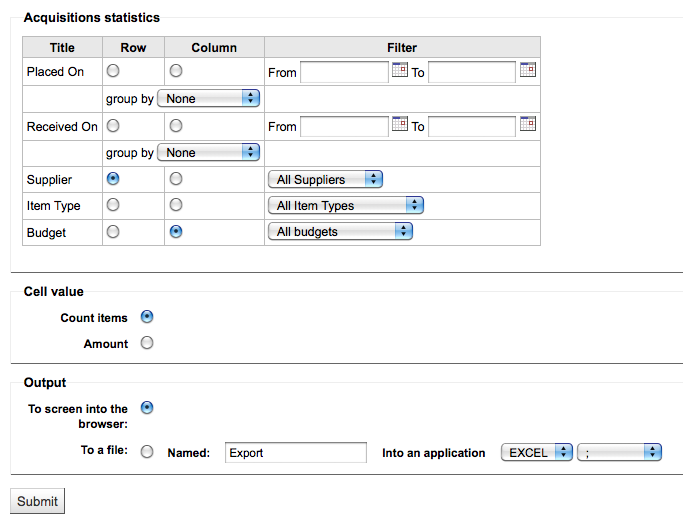
If you choose to output to the browser your results will print to the screen.
You can also choose to export to a file that you can manipulate to your needs.
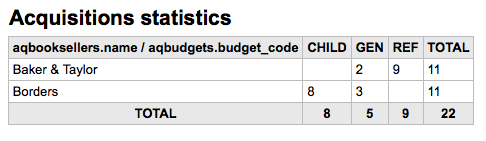
When generating your report, note that you get to choose between counting or summing the values.
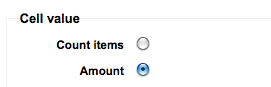
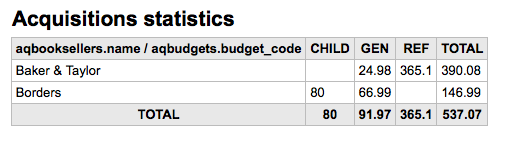
Choosing amount will change your results to appear as the sum of the amounts spent.
Note
These reports are limited in what data they can look at, so it's often recommended to use custom reports for official end of the year statistics.
Using the form provided, choose which value you would like to appear in the Column and which will appear in the Row.
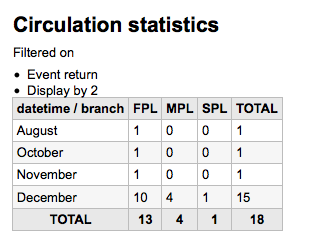
If you choose to output to the browser your results will print to the screen.
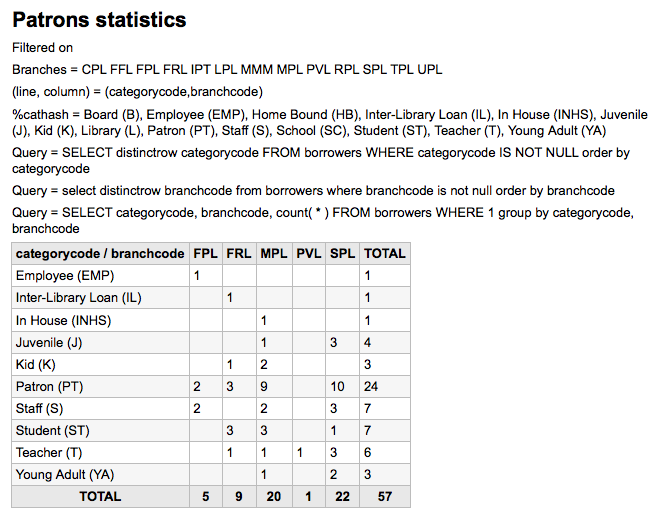
Based on your selections, you may see some query information above your results table. You can also choose to export to a file that you can manipulate to your needs.
Note
These reports are limited in what data they can look at, so it's often recommended to use custom reports for official end of the year statistics.
Using the form provided, choose which value you would like to appear in the Column and which will appear in the Row.
If you choose to output to the browser your results will print to the screen.
You can also choose to export to a file that you can manipulate to your needs.
Note
To get a complete picture of your monthly or daily circulation, you can run the report twice, once for 'Type' of 'Checkout' and again for 'Renewal.'
This report uses 'Period,' or date, filtering that allows you to limit to a month by simply selecting the first day of the first month through the first day of the next month. For example, 10/1 to 11/1 to find statistics for the month of October.
-
To find daily statistics, set your date range.</br> Example: "I want circulation data starting with date XXX up to, but not including, date XXX."
-
For a whole month, an example range would be: 11/01/2009 to 12/01/2009
-
For a whole year, an example range would be: 01/01/2009 to 01/01/2010
-
For a single day, an example would be: 11/15/2009 to 11/16/2009 to find what circulated on the 15th
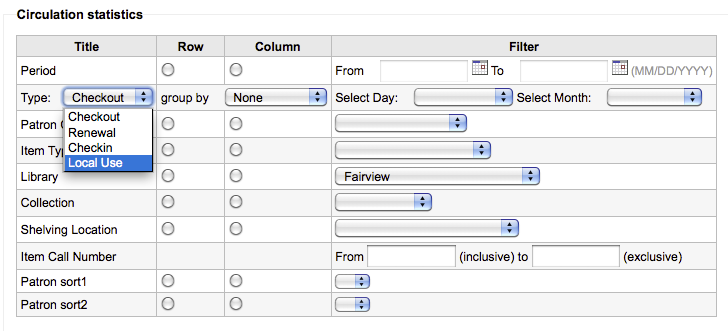
Using the Circulation statistics reporting wizard you can run reports on in house usage of items simply by choosing 'Local Use' from the 'Type' pull down:
Note
These reports are limited in what data they can look at, so it's often recommended to use custom reports for official end of the year statistics.
Using the form provided, choose how you would like to list the serials in your system.
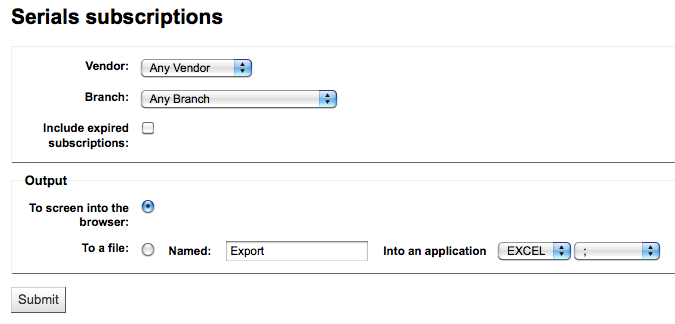
If you choose to output to the browser your results will print to the screen.
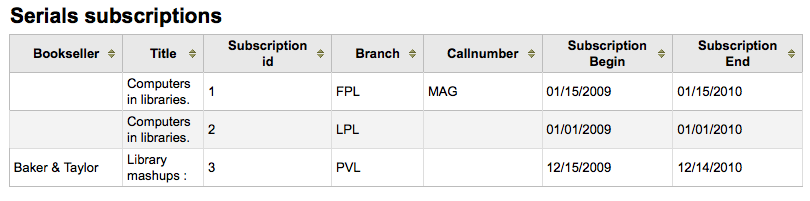
You can also choose to export to a file that you can manipulate to your needs.
Note
These reports are limited in what data they can look at, so it's often recommended to use custom reports for official end of the year statistics.
Using the form provided you can see statistics for holds placed, filled, cancelled and more at your library. From the form choose what value you want to display in the column and what value to show in the row. You can also choose from the filters on the far right of the form.
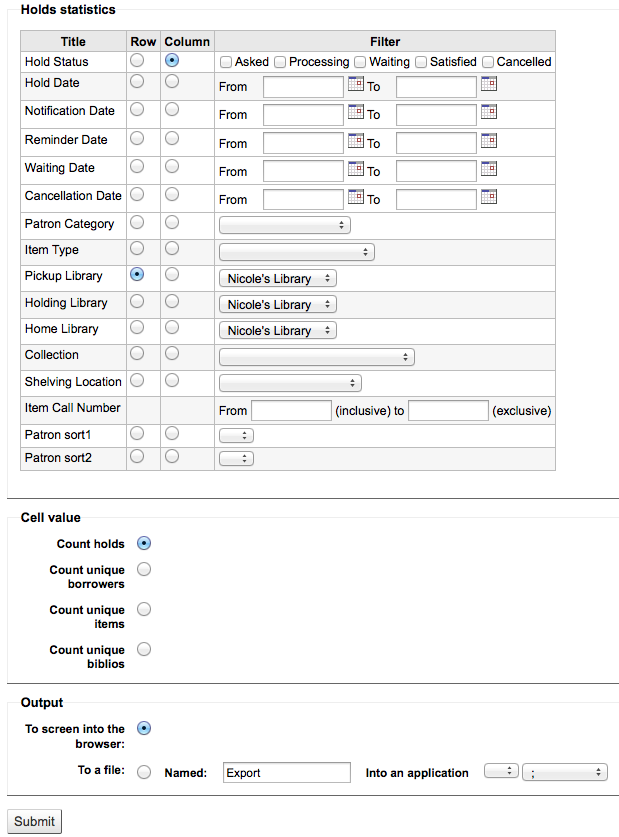
If you choose to output to the browser your results will print to the screen.
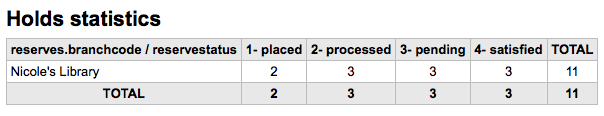
You can also choose to export to a file that you can manipulate to your needs.
This report will simply list the patrons who have the most checkouts.
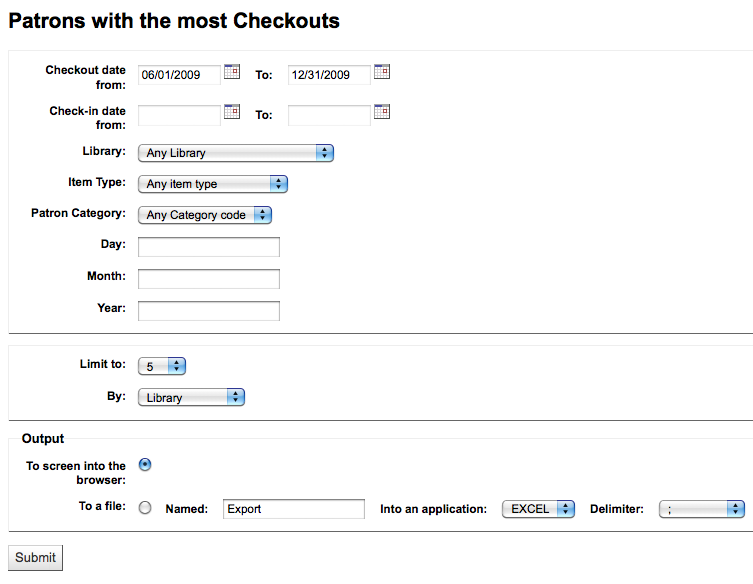
If you choose to output to the browser your results will print to the screen.
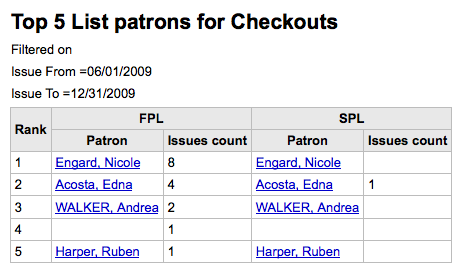
You can also choose to export to a file that you can manipulate to your needs.
This report will simply list the items that have the been checked out the most.
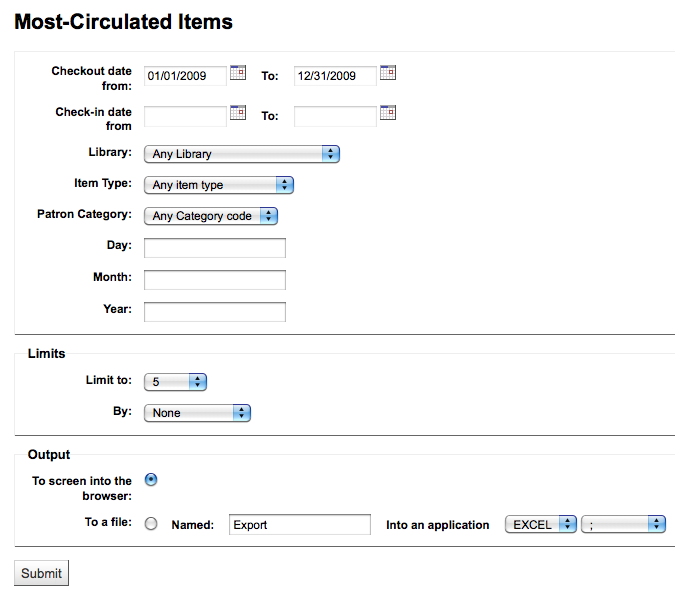
If you choose to output to the browser your results will print to the screen.
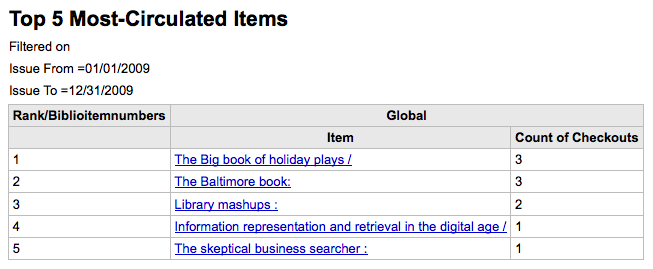
You can also choose to export to a file that you can manipulate to your needs.
This report will list for you the patrons in your system who haven't checked any items out.
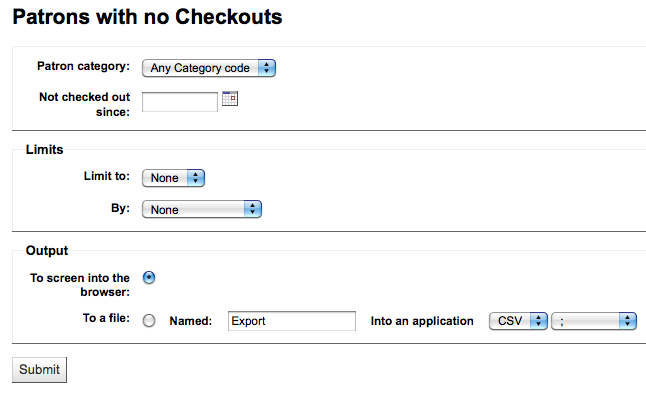
If you choose to output to the browser your results will print to the screen.
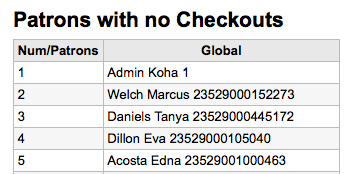
You can also choose to export to a file that you can manipulate to your needs.
This report will list items in your collection that have never been checked out.
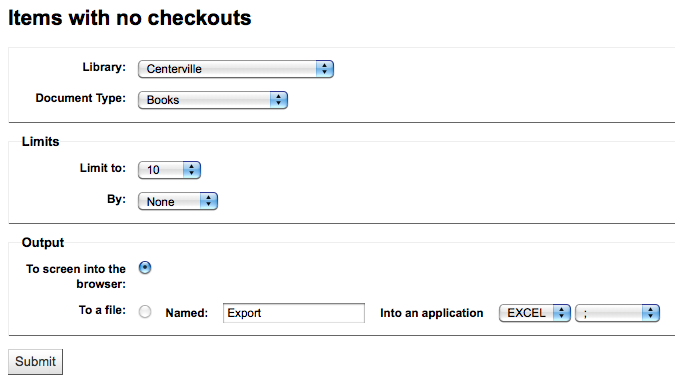
If you choose to output to the browser your results will print to the screen.
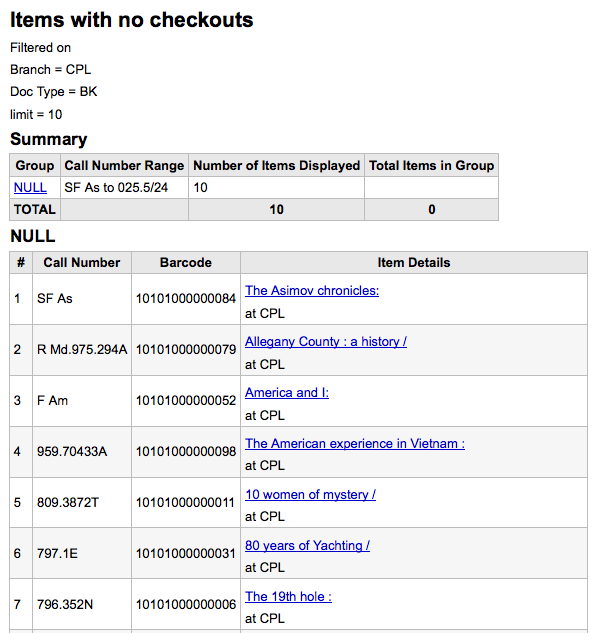
You can also choose to export to a file that you can manipulate to your needs.
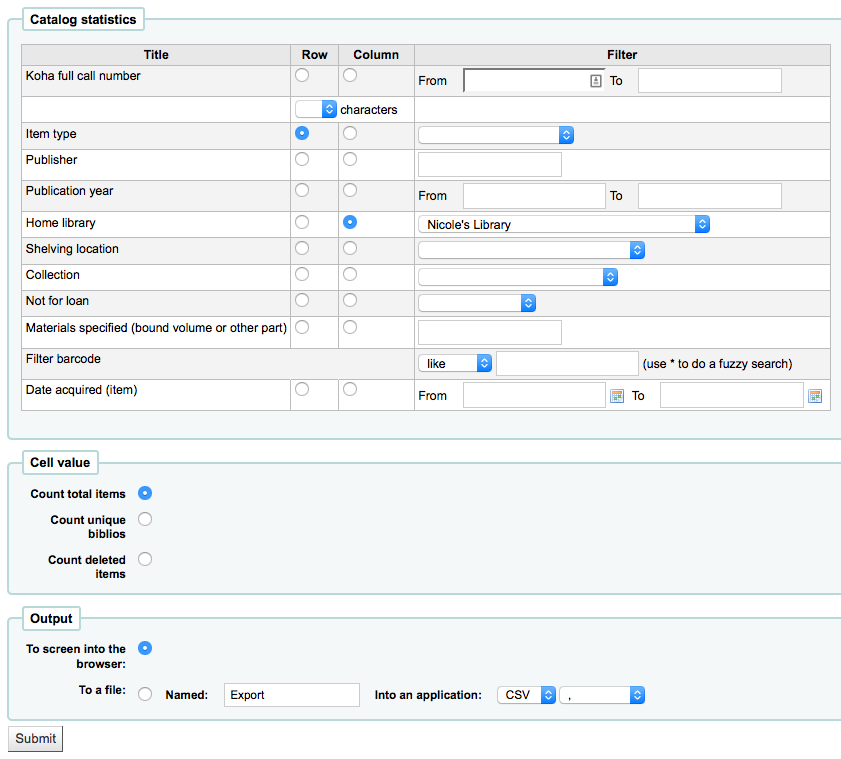
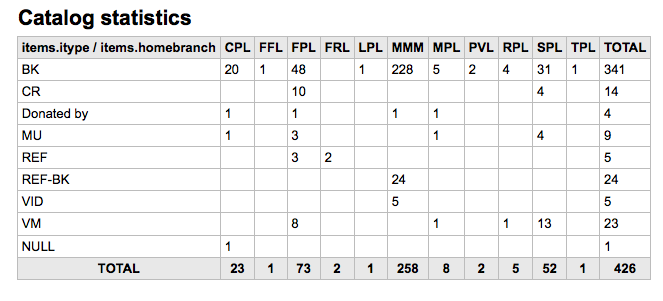
This report will list the total number of items of each item type per branch.
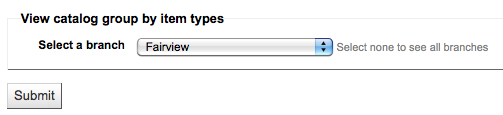
If you choose to output to the browser your results will print to the screen.
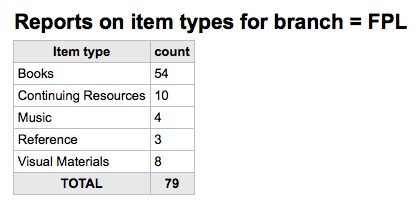
You can also choose to export to a file that you can manipulate to your needs.
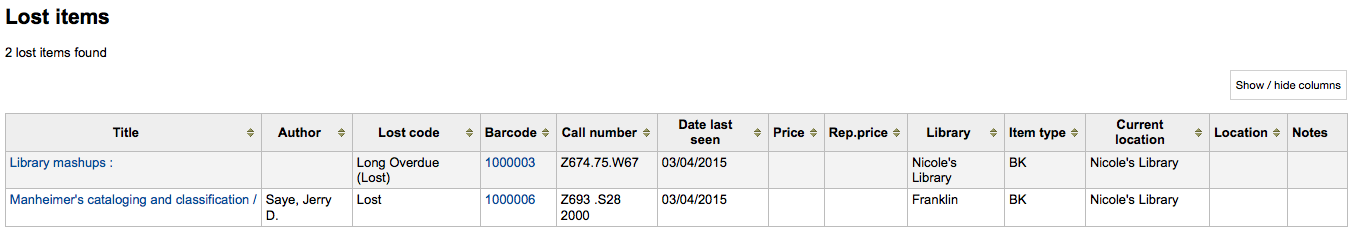
This report will allow you to generate a list of items that have been marked as Lost within the system
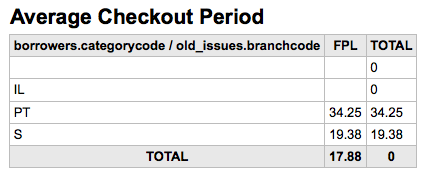
This report will list the average time items are out on loan based on the criteria you enter:
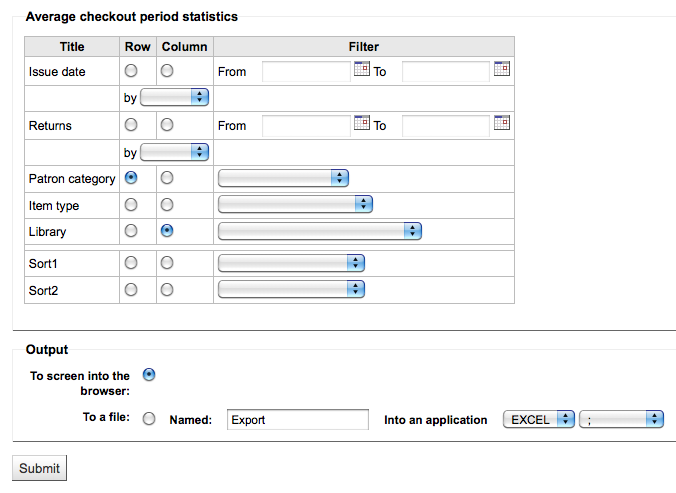
If you choose to output to the browser your results will print to the screen.
You can also choose to export to a file that you can manipulate to your needs.