Rapporter
Reports in Koha are a way to gather data. Reports are used to generate statistics, member lists, shelving lists, or any list of data in your database.
Get there: More > Reports
Custom reports
Koha’s data is stored in a MySQL database which means that librarians can generate nearly any report they would like by either using the guided reports wizard or writing their own SQL query.
Add custom report
Observera
Only staff with the create_reports permission (or the superlibrarian permission) will be able to create custom reports, either with the guided report wizard or directly with SQL.
Rapportguide
Rapportguiden leder dig genom en process i sex steg för att generera en rapport.
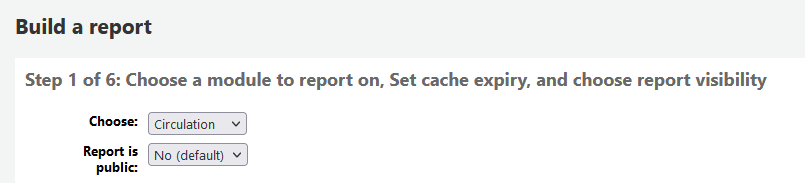
Step 1: Choose the module you want to report on. This will determine what tables and fields are available for you to query.
’Report is public’ should be left to the default of ’No’ in most cases especially if the report contains patron or other sensitive information. A public report can be accessed using the JSON reports services by anyone and without authentication.
Obs
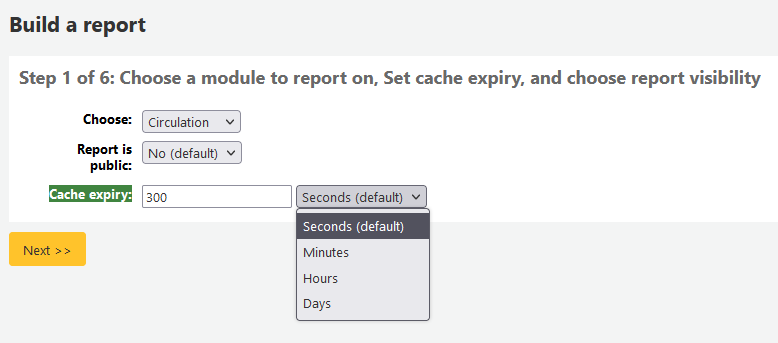
If your system administrator has set up memcache on your server you might see one more option for the Cache expiry. This is related to your public reports. If you make the report public then it’s constantly running and will cause a large load on your system. Setting this value prevents that.
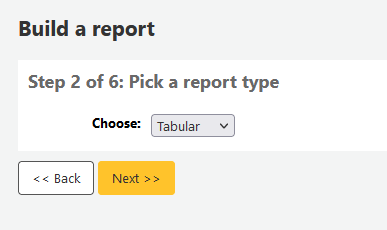
Step 2: Choose a report type. For now, Tabular is the only option available.
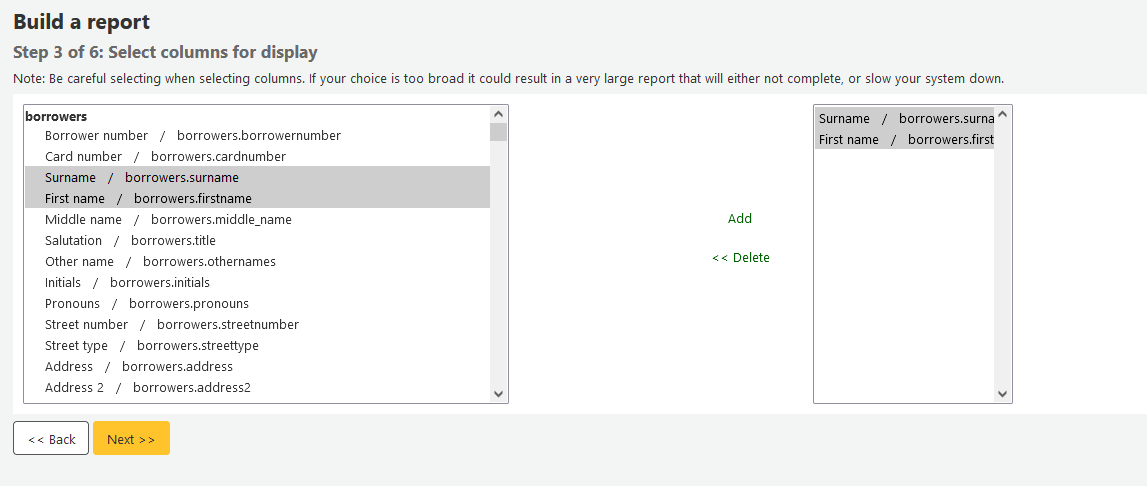
Step 3: Choose the fields you want in your report. You can select multiple fields and add them all at once by using CTRL+click on each item you want to add before clicking the Add button.
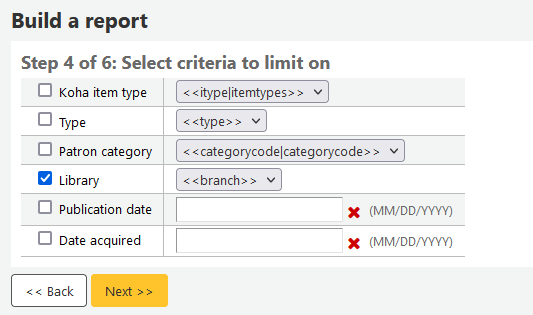
Step 4: Choose any limits you might want to apply to your report (such as item types or branches). If you don’t want to apply any limits, simply click ’Next’ instead of choosing an option.
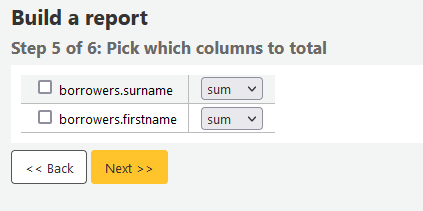
Step 5: Perform math functions. If you don’t want to do any calculations, simply click ’Next’ instead of choosing an option.
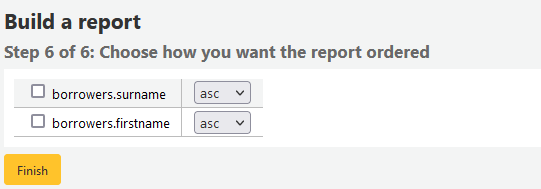
Step 6: Choose data order. If you want the data to print out in the order it’s found in the database, simply click ’Finish’.
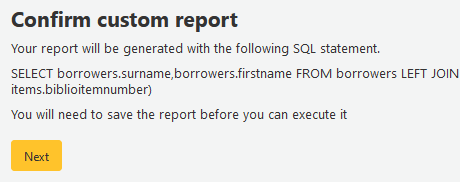
When you are finished you will be presented with the SQL generated by the report wizard. From here you can choose to save the report by clicking ’Finish’ or copy the SQL and make edits to it by hand.
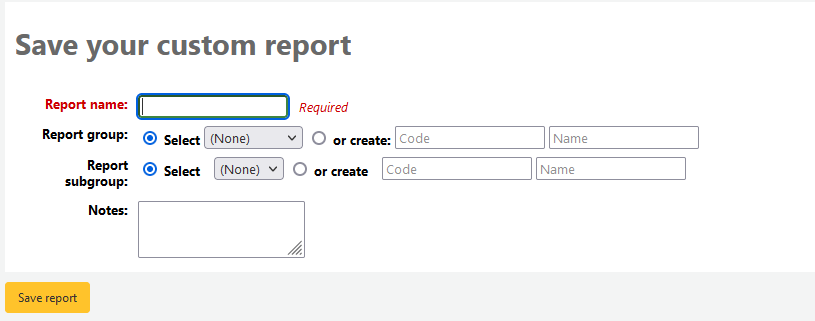
Om du väljer att spara rapporten ombeds du att ge den ett namn, lägga in den i grupper och undergrupper samt skriva in eventuella kommentarer om rapporten.
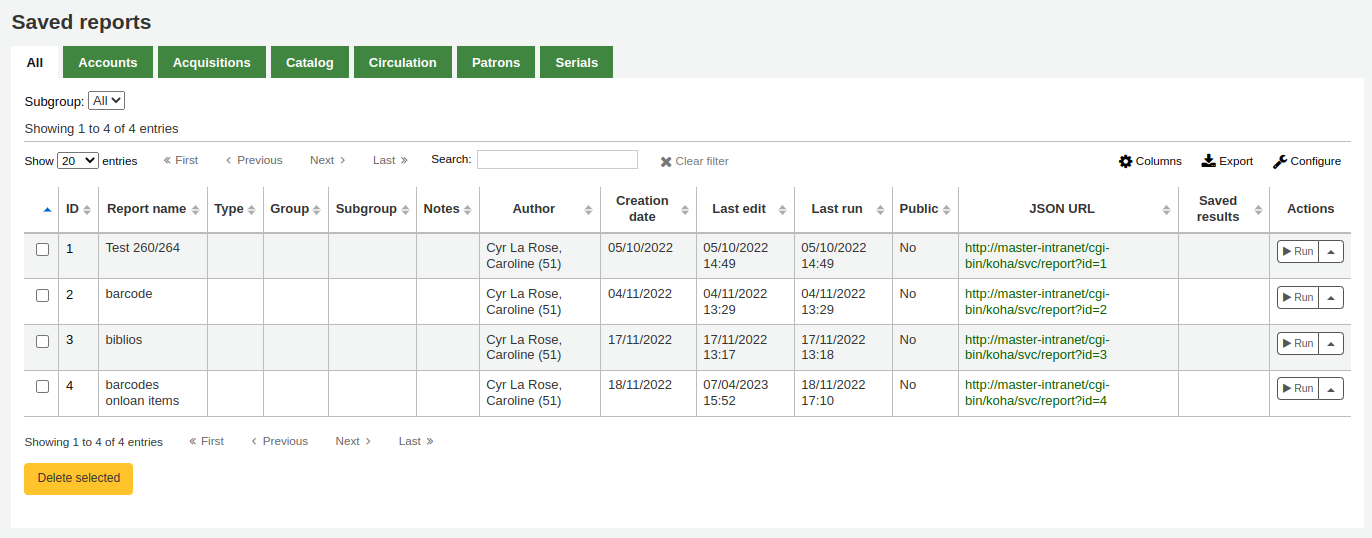
Once your report is saved it will appear on the ’Use saved’ page with all other saved reports.
Obs
You can customize the columns of this table in the ’Table settings’ section of the Administration module (table id: table_reports).
Härifrån kan du redigera, köra rapporten eller schemalägga en tid då rapporten ska köras. För att hitta den rapport du skapade kan du sortera efter alla kolumner genom att klicka på kolumnrubriken (datumkolumnen skapad är det enklaste sättet att hitta rapporten du just la till). Du kan också filtrera dina resultat med filtermenyn på vänster sida eller använda flikarna för att hitta rapporter baserat på dina anpassade grupper.
Rapport från SQL
In addition to the report wizard, you have the option to write your own queries using SQL. To find reports written by other Koha users, visit the Koha wiki: http://wiki.koha-community.org/wiki/SQL_Reports_Library. You can also find your database structure in /installer/data/mysql/kohastructure.sql or online at: http://schema.koha-community.org.
To add your query, click the link to ’Create from SQL’ on the main reports module
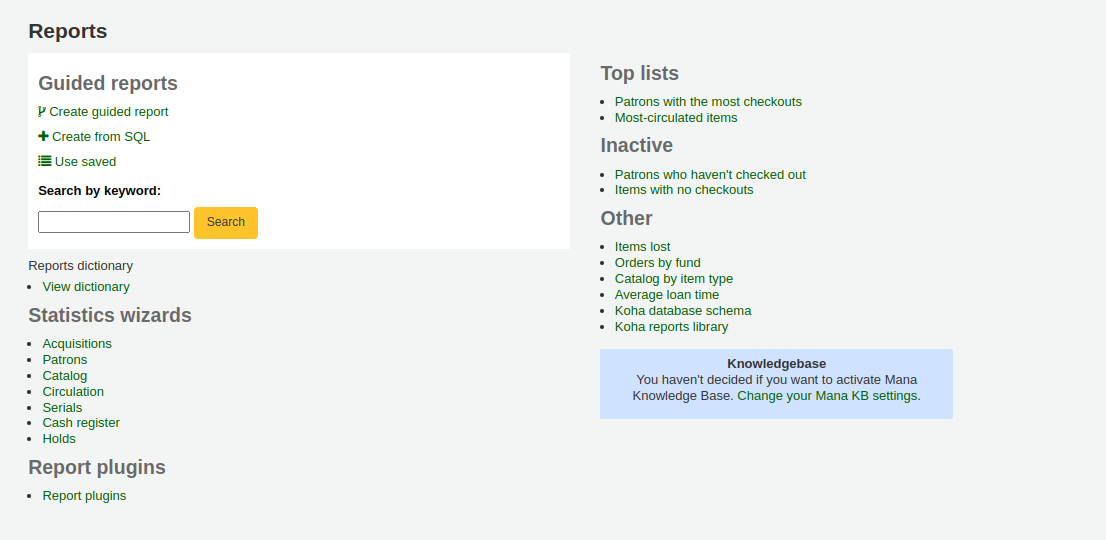
or the ’New report’ button at the top of the ’Saved reports’ page.

Fyll i det formulär som visas
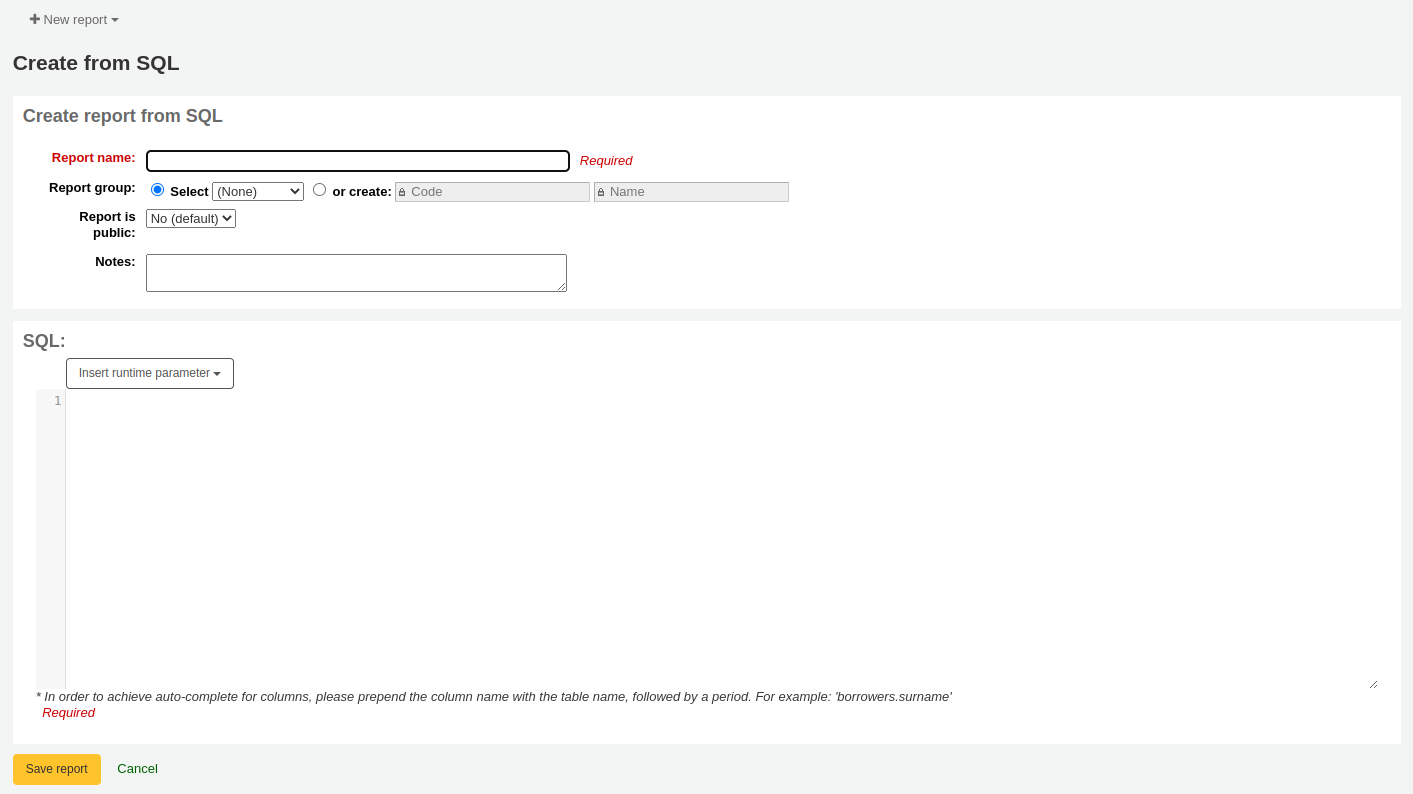
Report name: the name is what will appear on the ’Saved reports’ page to help you identify the report later. It will also be searchable using the filters found on the left of the ’Saved reports’ page.
Report group: you can use the ’Report group’ to organize your reports in tabs on the ’Saved reports’ page. You can choose from the list of existing groups, or create one on the fly by choosing the ’or create’ radio button.
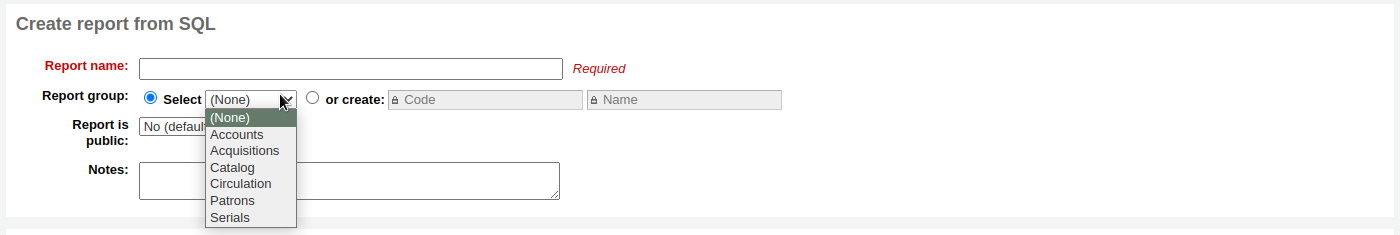
Report groups are set in the REPORT_GROUP authorized value category.
Varning
If you’re adding a report group on the fly, the code should not include special characters or spaces.
Report subgroup: if you chose a report group, this field will appear to further organize your reports. Choose a subgroup from the list, or create one on the fly by choosing the ’or create’ radio button.
Report subgroups are set in the REPORT_SUBGROUP authorized value category.
Observera
Report subgroups need to have unique values in ’Authorized value’ and ’Description’. The ’Description (OPAC)’ field needs to contain the authorized value for the report group that the subgroup falls under.
Varning
If you’re adding a report subgroup on the fly, the code should not include special characters or spaces.
Report is public: this should be left to the default of ’No’ in most cases, especially if the report contains patron or other sensitive information. A public report can be accessed using the JSON reports services by anyone and without authentication.
Cache expiry: this field will only appear if your system administrator has set up memcache on your server. This is related to public reports. If you make the report public, it’s constantly running and will cause a large load on your system. Setting this value prevents that.
Notes: notes will appear on the ’Saved reports’ page, and can be used to provide more details about the report or tips on how to enter values when it runs.
SQL: type or paste the SQL for the report (see report writing tips below).
Once everything is entered click the ’Save report’ button and you’ll be presented with options to run it. From here, you can also edit it, duplicate it, or schedule it to be run later.
Once a report is saved, you do not have to recreate it, it will appear on the ’Saved reports’ page with all other saved reports.
Observera
You can customize the columns of this table in the ’Table settings’ section of the Administration module (table id: table_reports).
From the ’Saved reports’ page, you can make edits, run the report, or schedule a time to run the report later. To find the report you created, you can sort by any of the columns by clicking on the column header (creation date is the best to find the report you just added). You can also filter your results using the filter menu on the left or use the tabs to find reports based on your custom groups.
SQL Report writing tips
Autocomplete
When you start typing in the SQL field, autocomplete options will be displayed.
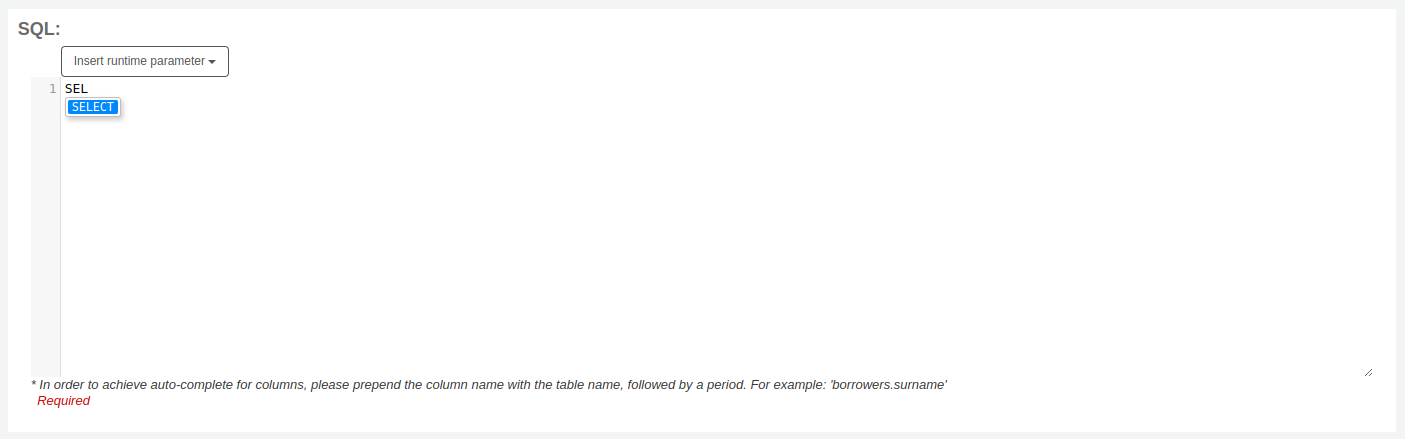
Use the arrows on your keyboard to choose the correct option and press ’Enter’ or ’Tab’ to insert it into your report, or simply click on the option to insert it.
Autocomplete options include:
SQL keywords such as SELECT, FROM, WHERE, etc.
table names
column names
Observera
To have suggestions for column names, you must type the table name first, followed by a period, then start typing the column name.
For example, to have the suggestion for
cardnumber, you must typeborrowers.ca.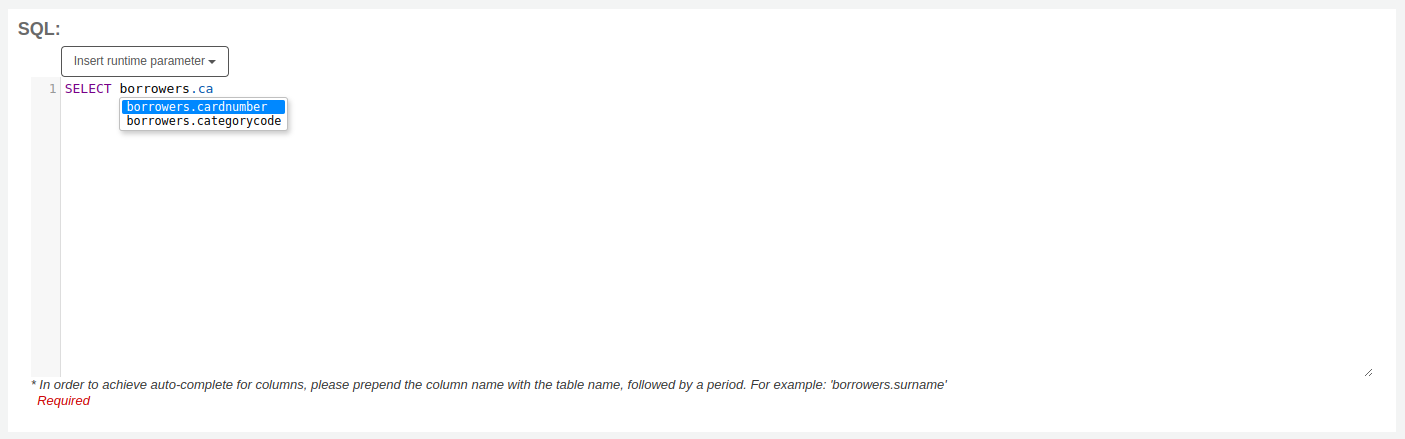
Runtime parameters
If you feel that your report might be too resource intensive you might want to consider using runtime parameters to your query. Runtime parameters basically make a filter appear before the report is run to save your system resources.
Click the button ’Insert runtime parameter’ and choose which parameter to add.
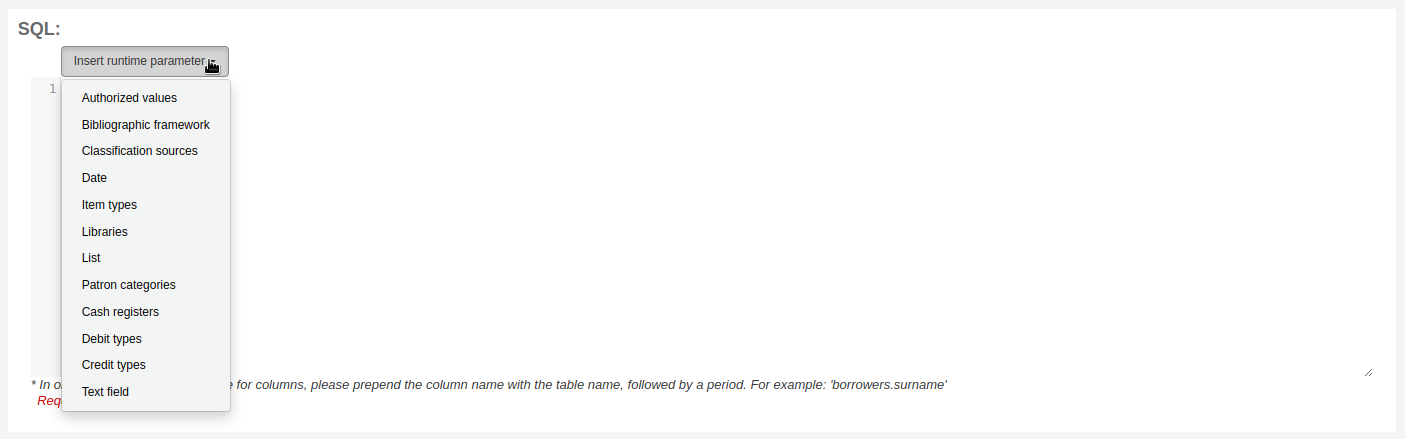
Authorized value: will display a drop down menu of the value descriptions from the chosen authorized value category. The authorized value code will be inserted in the report when it is run.
Bibliographic framework: will display a drop down menu of MARC bibliographic frameworks. The framework code will be inserted in the report when it is run.
Classification sources: will display a drop down menu of classification sources. The classification code will be inserted in the report when it is run.
Date: will display a calendar to pick a date. The date in YYYY-MM-DD format will be inserted in the report when it is run.
Item types: will display a drop down menu of item types. The item type code will be inserted in the report when it is run.
Libraries: will display a drop down menu of libraries. The library code (branchcode) will be inserted in the report when it is run.
List: will display a large text box in which the user can enter many values, one per line. Those values will be inserted in the report, separated by commas, when it is run.
Varning
In the case of the list parameter, users must write one value per line.
Patron categories: will display a drop down menu of patron categories. The category code will be inserted in the report when it is run.
Cash registers: will display a drop down menu of cash registers. The cash register’s internal id will be inserted in the report when it is run.
Debit types: will display a drop down menu of debit types. The debit type code will be inserted in the report when it is run.
Credit types: will display a drop down menu of credit types. The credit type code will be inserted in the report when it is run.
Text field: will display an empty text field in which the user can enter any text.
Observera
You have to put ”%” in a text box to ’leave it blank’. Otherwise, it literally looks for ”” (empty string) as the value for the field.
For example entering nothing for: ”title=<<Enter title>>” will display results with title=’’ (no title).
If you want to have to have something not mandatory, use ”title like <<Enter title>>” and enter a % at run time instead of nothing.
After you choose the type of runtime parameter, it will ask you for the parameter label. This is what the user will see as the label for the choice they have to make or text they have to enter.
The syntax inserted into the report is <<Label|authorized_value>>.
The << and >> are just delimiters to indicate the start and end of the runtime parameter.
The label will be displayed on the left of the choice or value to enter.
The authorized_value can be omitted if not applicable. If it is absent, a free text field will be displayed. If it contains an authorized code (see table below), a drop down of the values will be displayed.
Observera
You can write those in manually as well, you don’t have to go through the ’Insert runtime parameter’ button. As long as the syntax is correct, Koha will interpret it as a runtime parameter.
List of parameters that can be used in runtime parameters
Parameter |
What the user sees |
What gets inserted in query |
|---|---|---|
date |
date picker |
validly formatted date |
branches |
drop down of branch names |
branch code |
itemtypes |
drop down of item type names |
item type |
categorycode |
drop down of patron category descriptions |
borrower category code |
biblio_framework |
drop down of MARC bibliographic frameworks |
framework code |
list |
large text box |
comma separated values |
(auth-value-category) |
drop down of auth-value descriptions in category |
authorized value |
(nothing) |
text box |
entered text |
Observera
You can have more than one runtime parameter in a given SQL query.
Observera
When using runtime parameters that create drop down menus you can optionally specify whether to include an option for ’All’ or to allow multiple selections.
To include an option for all the syntax is
LIKE <<Label|branches:all>>.To allow multiple selections the syntax is
IN <<Label|itemtypes:in>>.
SELECT *
FROM
items i
WHERE
i.homebranch LIKE <<Library|branches:all>>
AND
i.itype IN <<Item type|itemtypes:in>>
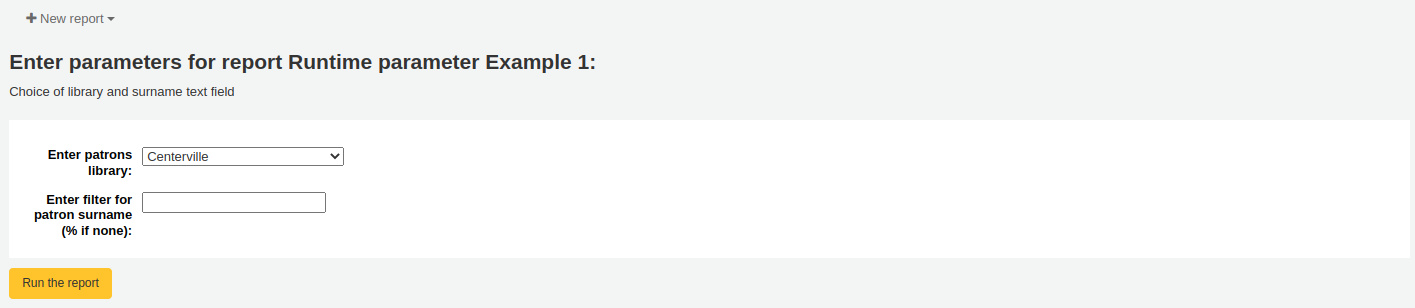
Example 1
SELECT surname,
       firstname
FROM borrowers
WHERE branchcode = <<Enter patrons library|branches>>
    AND surname LIKE <<Enter filter for patron surname (% if none)>>
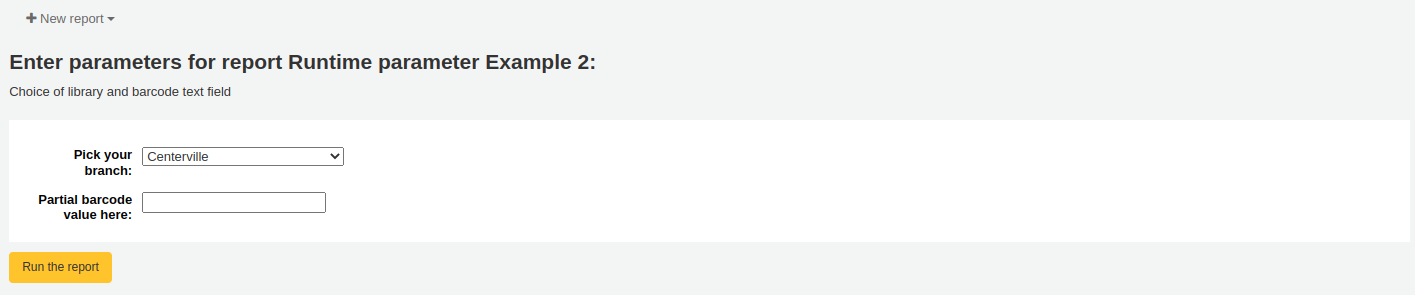
Example 2
SELECT *
FROM items
WHERE homebranch = <<Pick your branch|branches>>
    AND barcode LIKE <<Partial barcode value here>>
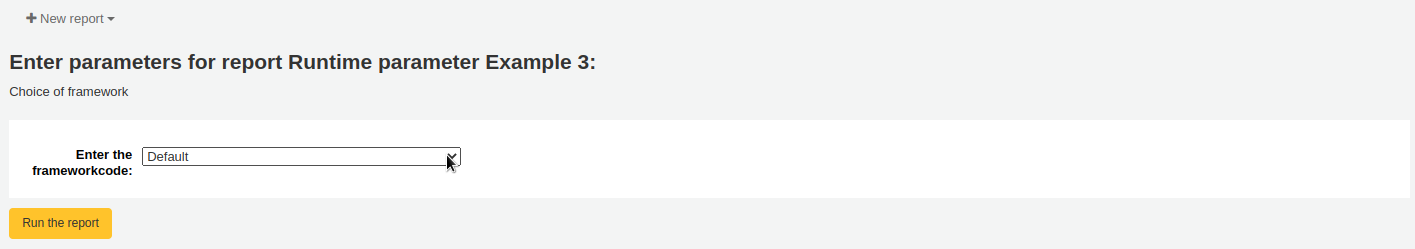
Example 3
SELECT title,
       author
FROM biblio
WHERE frameworkcode = <<Enter the frameworkcode|biblio_framework>>
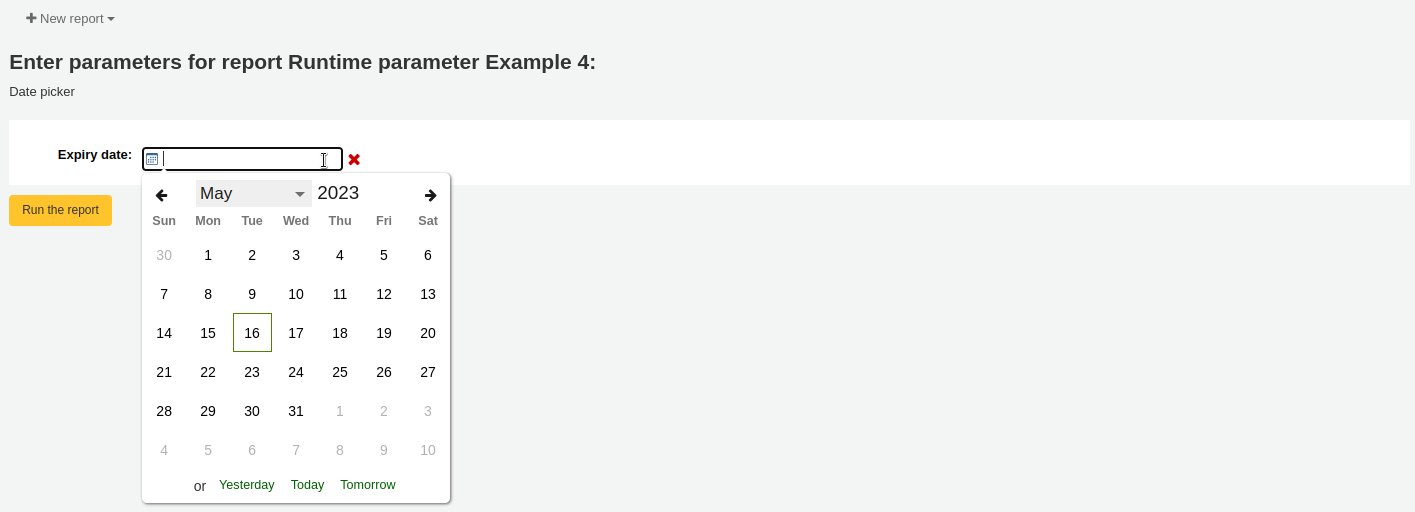
Example 4
SELECT cardnumber,
       surname,
       firstname
FROM borrowers
WHERE dateexpiry <= <<Expiry date|date>>
Example 5
SELECT *
FROM items
WHERE itemnumber IN <<List of itemnumbers (one per line)|list>>
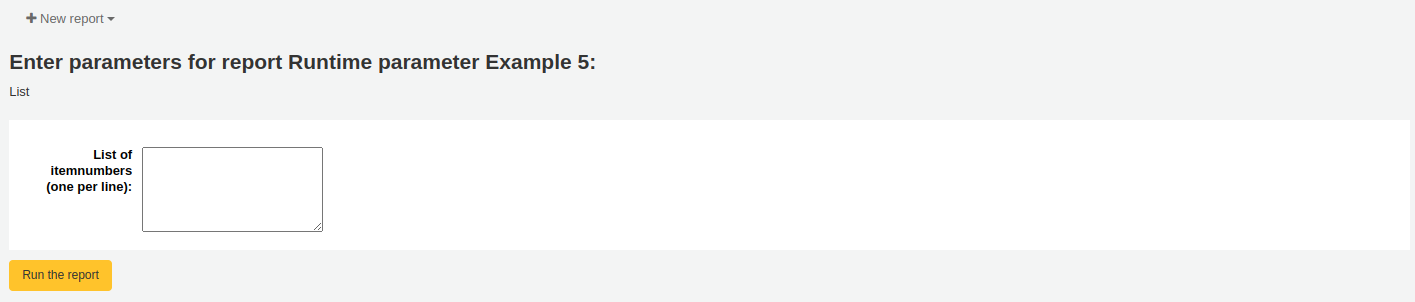
Varning
In the case of the list parameter, users must write one value per line.
Column names
You can use an SQL alias to rename columns.
Example
SELECT surname AS "Last Name"
FROM borrowers
For reports whose results you wish to send to batch modification tools or generate automatic hyperlinks to use [[batch field|Column Name]] to rename the itemnumber, biblionumber or borrowernumber columns. For example, [[itemnumber|Item Number]] will format the itemnumber column as ”Item Number”, while allowing those results to be sent to the batch item modification tool.
Example
SELECT [[borrowernumber|Borrower Number]], firstname AS "First Name", surname AS "Last Name"
FROM borrowers
Hyperlinks
It can be useful to add clickable links to reports to make it easier for staff to navigate directly to specific results.
Koha will automatically generate hyperlinks for any report that contains a borrowernumber, cardnumber, itemnumber or biblionumber.
Observera
The column name must match the type of data your are inserting. Please see Column names for more details on naming columns for automatic hyperlinks.
When a user clicks on the number, the menu will prompt the user to click which Koha page they wish to visit.
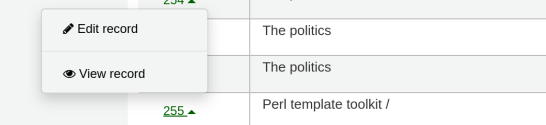
Available actions for each automatic link are:
borrowernumber: View, edit, check out
cardnumber: Check out
itemnumber: View, edit
biblionumber: View, edit
You may wish to make this a single click by directly linking to a specific page, or you may wish to make other data into clickable links; to make a book’s title a clickable link that brings the user to the bibliographic record, for example. Koha will insert HTML links added to the SELECT statement and by using CONCAT, data from the report results can be added to create a clickable link.
Example 1
This example uses the string /cgi-bin/koha/members/boraccount.pl?borrowernumber=XXXX to insert a direct link to a borrower. The end user will see the borrower’s library barcode number.
SELECT CONCAT('<a href=\"/cgi-bin/koha/members/boraccount.pl?borrowernumber=',borrowernumber,'\">', cardnumber, '</a>'), surname, firstname
FROM borrowers
Observera
Koha will automatically insert your library’s top level domain when a user clicks the link, so only ”cgi-bin” and onward is required.
Observera
The example uses single quotation marks to separate the CONCAT segments, which are joined by commas. Below is a detailed explanation of the sections, each of which is separated by a comma:
CONCAT- This SQL command combines separate queries and strings into a single column. Parentheses will enclose the next entries.'<a href="/cgi-bin/koha/members/boraccount.pl?borrowernumber='- The beginning of an HTML link tag and Koha URL that points to a specific borrower. The single quotation marks ensure the string is printed literally. You must escape the double quotation marks with a backslash to ensure Koha interprets it literally rather than as part of the SQL.borrowernumber- The borrower number from the database. This is not enclosed by single quotation marks because we wish to query Koha.'">'- The end of an opening HTML tag for a link. Again wrapped in single quotation marks.cardnumber- The borrower’s barcode number queried from Koha. This is what will be visible to the user and comprise the clickable link.'</a>'- A closing tag of an HTML link. Wrapped in single quotation marks.
Example 2
This example will link directly to an item, displaying the item’s barcode to the user.
SELECT CONCAT('<a href=\"/cgi-bin/koha/catalogue/moredetail.pl?itemnumber=',itemnumber,'\">', barcode , '</a>')
FROM items
Example 3
This example will link to a bibliographic record and display the item’s title.
SELECT CONCAT('<a href=\"/cgi-bin/koha/catalogue/detail.pl?biblionumber=',biblionumber,'\">', title , '</a>')
FROM biblio
SQL report from Mana
In the ”Create report from SQL”, you can search Mana KB for pre-made reports by clicking on ”New report” and choosing ”New SQL from Mana”.
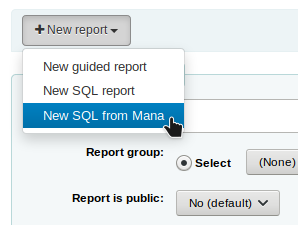
Obs
This option will only appear if you’ve configured Mana KB in the administration module.
You will be prompted to enter keywords to search the knowledge base.
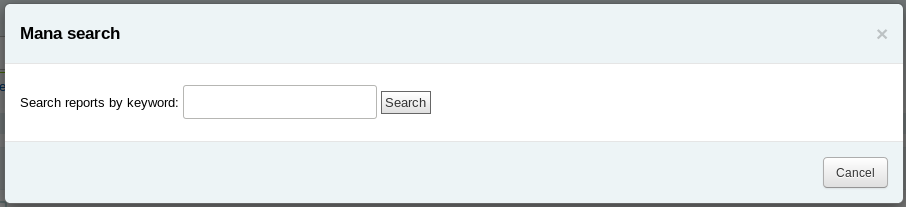
In the search results, you will see
the details of the report (name, notes and type)
how many people have used this entry (# of users)
when it was used for the last time (last import)
additional comments made by other Koha users (comments)
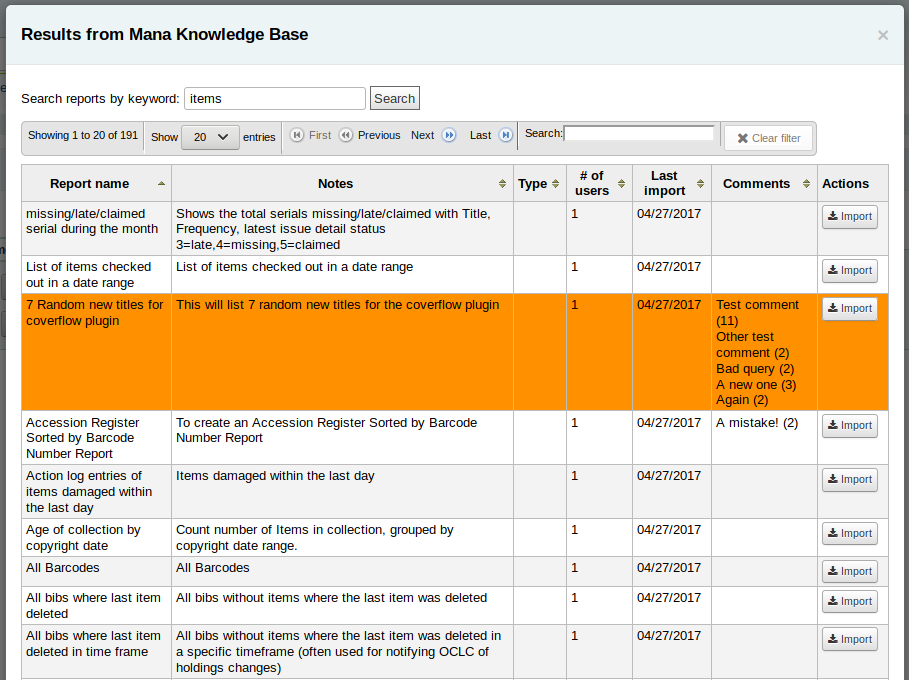
Click on ”Import” to import a copy of the report in your own saved reports.
You can then edit it, duplicate it, delete it, run it as you would any of your own reports.
Duplicate report
Reports can also be added by duplicating an existing report. Visit the ’Saved reports’ page to see all of the reports listed on your system already.
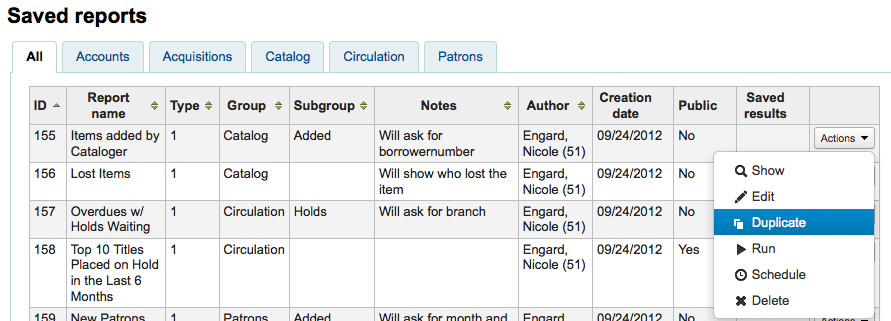
Till höger om varje rapport finns rullgardinsmenyn ’Åtgärder’. Klicka på den och välj ’Kopiera’ för att använda en befintlig rapport som grund för din nya rapport. Det ger dig en rapport med alla SQL-data ifyllda som sedan är lätt att redigera och spara om.
Edit custom reports
Every report can be edited from the reports lists. To see the list of reports already stored in Koha, click ’Use saved.’
Obs
You can customize the columns of this table in the ’Table settings’ section of the Administration module (table id: table_reports).
För att hitta den rapport du vill redigera kan du sortera kolumnerna genom att klicka på kolumnrubriken. Du kan också filtrera resultaten med filtermenyn till vänster eller använda flikarna för att hitta rapporter baserade på dina anpassade grupper.
Från denna lista kan du redigera anpassade rapporter genom att klicka på ’Åtgärder’ till höger om rapporten och välja ’Redigera’ från menyn som visas.
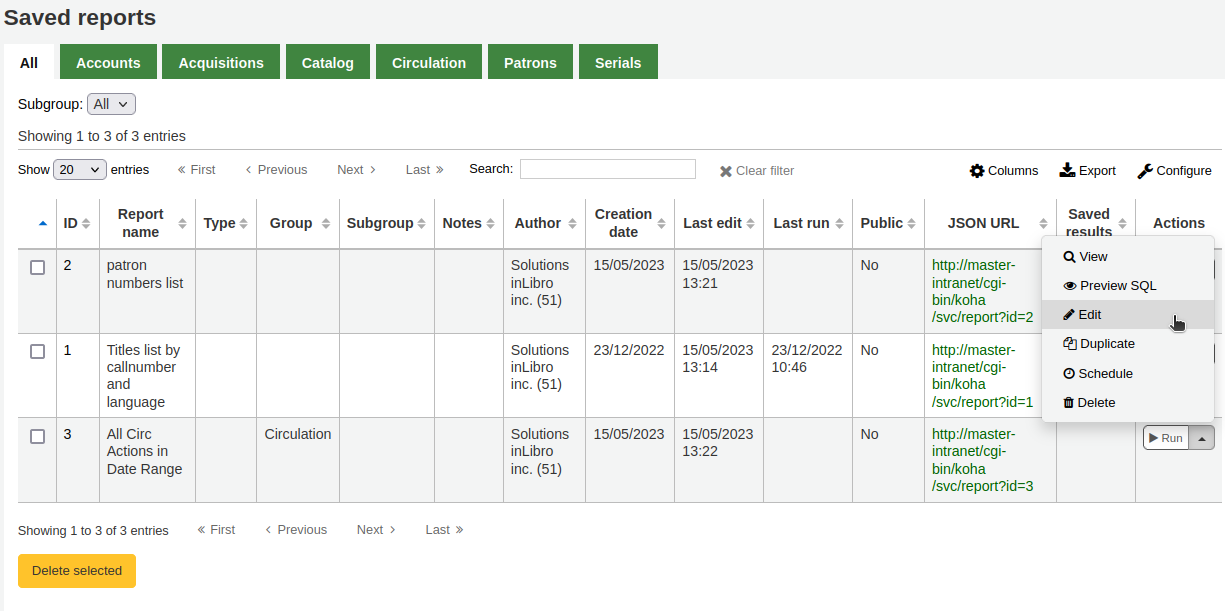
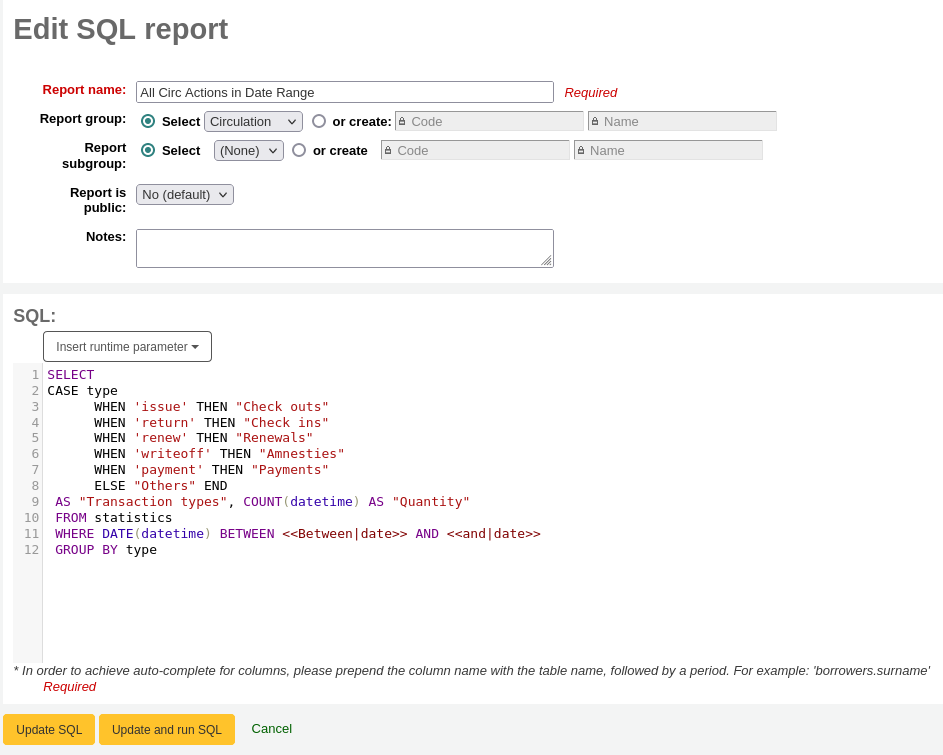
The form to edit the report will appear. Use the ”update button” to save your modifications or click on ”update and run SQL” to save and display the report results.
Running custom reports
Observera
Only staff with the execute_reports permission (or the superlibrarian permission) will be able to run existing reports.
Once custom reports are saved to Koha, you can run them by going to the Saved Reports page and clicking the ’Run’ button to the right of the report.
When your report runs, you will either be asked for some values,
or you will see the results right away.
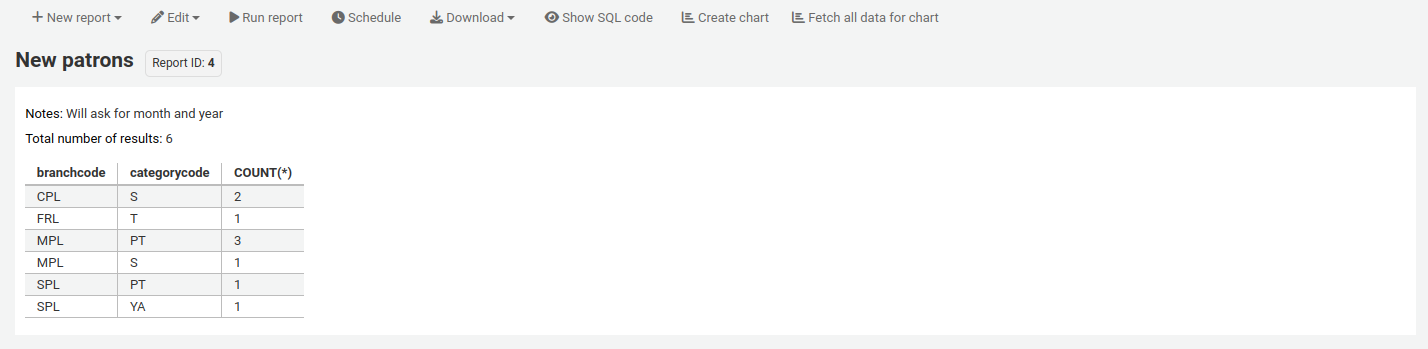
From the results you can do various actions with the button bar at the top of the page.
New report: create a brand new report.
New guided report: goes to the guided report wizard
New SQL report: goes to the create from SQL section
New SQL from Mana: this option only appears if Mana is set up, to search Mana for an existing SQL report.
Edit:
Edit: edit the current report
Duplicate: create a new report from the existing one
Delete: delete the current report
Run report: rerun the report
Run with template: this button only appears if you have notice templates in the notices and slips tool that are for reports.
Version
This option was added to Koha in version 23.11.
Tips
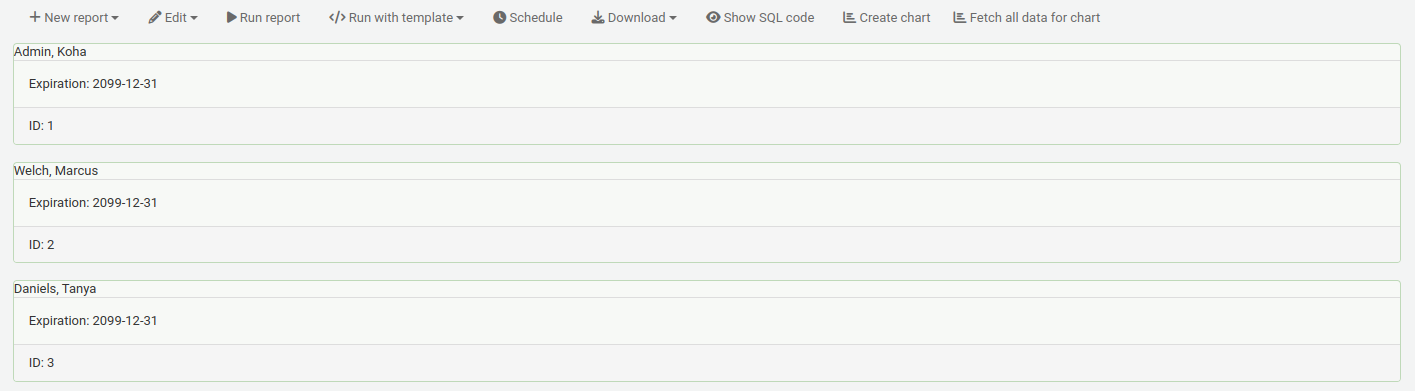
To view the results in a format other than the traditional table, you can create a template in the notices and slips tool.
For example, to view patron information in ’card’ form,
Go to Tools > Notices and slips.
Click ’New notice’, and choose ’Reports’.
Fill out the code and name for the slip. The name will be what appears in the ’Run with template’ menu.
In the ’Print’ template section, paste the code:
[% FOREACH b IN data %]
<div class="panel panel-default">
  <div class="panel-heading">[% b.surname %], [% b.firstname %]</div>
  <div class="panel-body">Expiration: [% b.dateexpiry %]</div>
  <div class="panel-footer">ID: [% b.borrowernumber %]</div>
</div>
[% END %]
Click ’Save’.
In a report with patron information, for example,
SELECT * FROM borrowers LIMIT 50
Click ’Run with template’ and choose the template.
Instead of a table, the results will appear in ’card’ form.
Schedule: schedule the report to be run at a later time with the task scheduler tool
Download: download the results
Comma separated text (.csv): a comma separated text file is a CSV file and it can be opened by any spreadsheet application or a text editor
Tab separated text: a tab separated text can also be opened by any spreadsheet or a text editor
Open Document Spreadsheet: ODS is an open-source spreadsheet file that can be opened in most spreadsheet applications
Rendered template: this option only appears if there are notice templates in the notices and slips tool that are for reports, and the report was ”run with template” (see above). It allows you to download the report results with the template applied.
Version
This option was added to Koha in version 23.11.
Show SQL code: show the SQL query used to get those results
Create chart: create a pie chart or a line/bar chart with the visible results
Fetch all data for chart: make all the data visible to make a chart with all the data
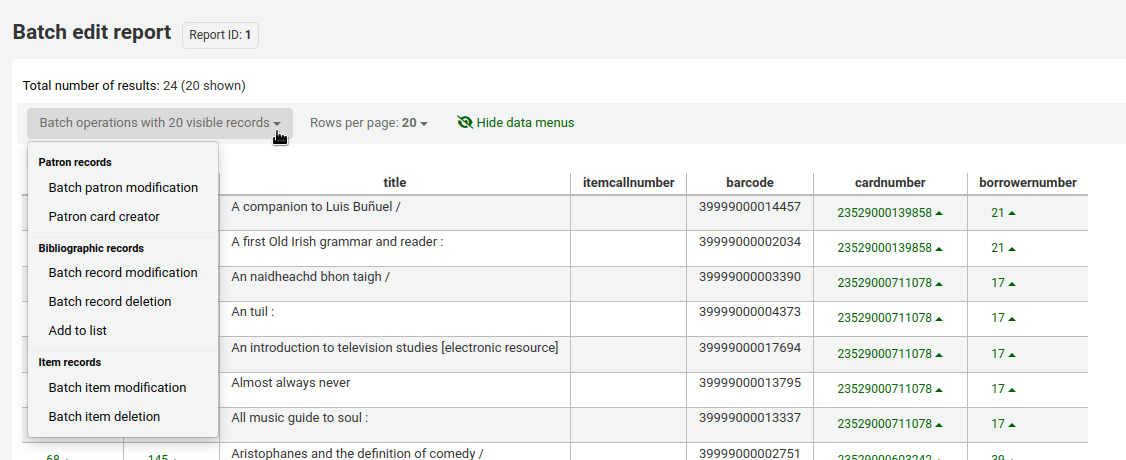
Send report output to batch modification tools
After running a report that contains itemnumbers, biblionumbers and/or patron cardnumbers the list of numbers can be imported directly into the relevant batch modification tool by clicking the ’Batch operations with X visible records’ button in the report results. The X depends on the number of records you have chosen to display on screen (up to 1000).
Statistics reports
Statistic reports will show you counts and sums. These reports are all about numbers and statistics, for reports that return more detailed data, use the guided report wizard. These reports are limited in what data they can look at, so it’s often recommended to use custom reports for official end of the year statistics.
Observera
Only staff with at least one of the reports permissions (or the superlibrarian permission) will be able to use the statistics wizards.
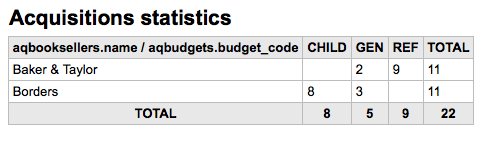
Inköpsstatistik
Obs
These reports are limited in what data they can look at, so it’s often recommended to use custom reports for official end of the year statistics.
Using the form provided, choose which value you would like to appear in the column and which will appear in the row.
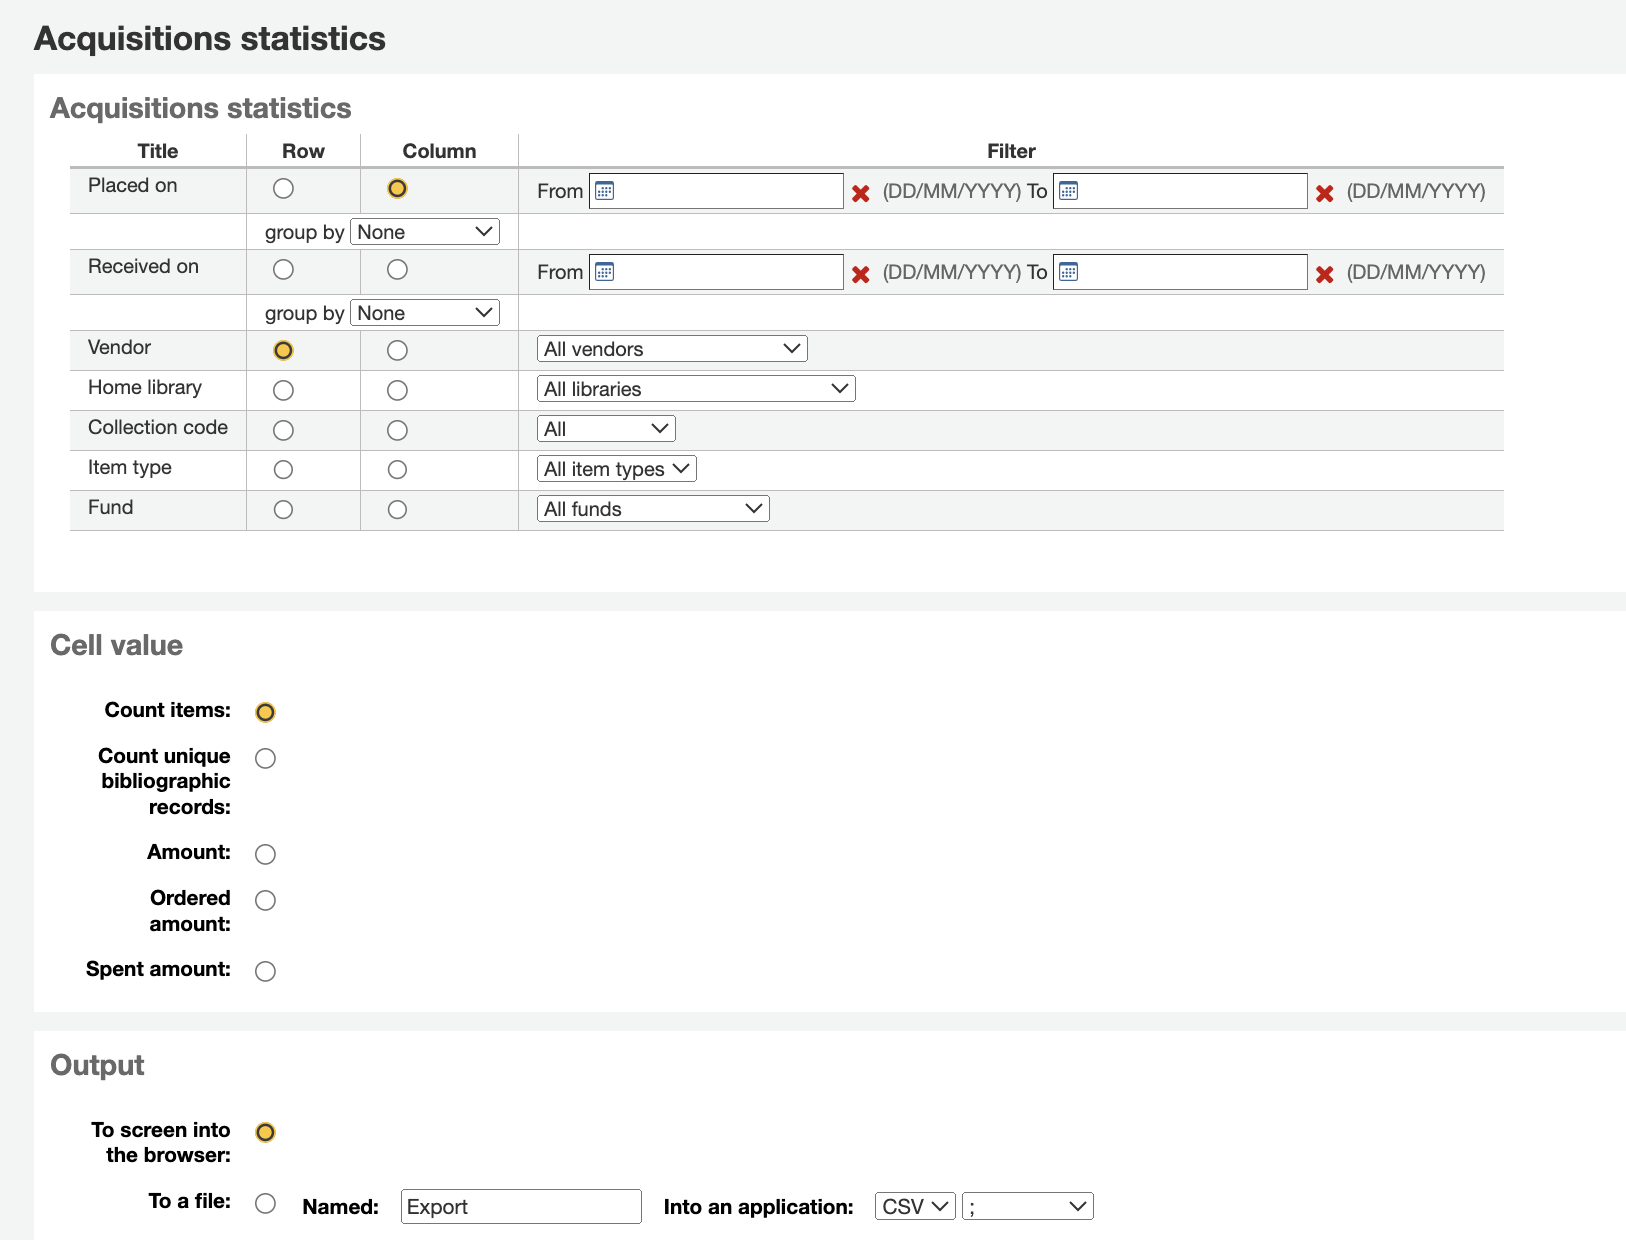
Om du väljer att skicka till webbläsaren kommer resultaten att visas på skärmen.
Du kan även exportera till en fil som du kan bearbeta efter behov.
När du genererar rapporten kan du välja mellan att räkna eller summera värdena.
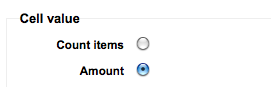
Väljer du belopp ändras resultaten så att de visas som summan av använda belopp.
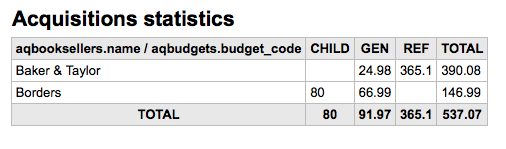
Låntagarstatistik
Obs
These reports are limited in what data they can look at, so it’s often recommended to use custom reports for official end of the year statistics.
Using the form provided, choose which value you would like to appear in the column and which will appear in the row.
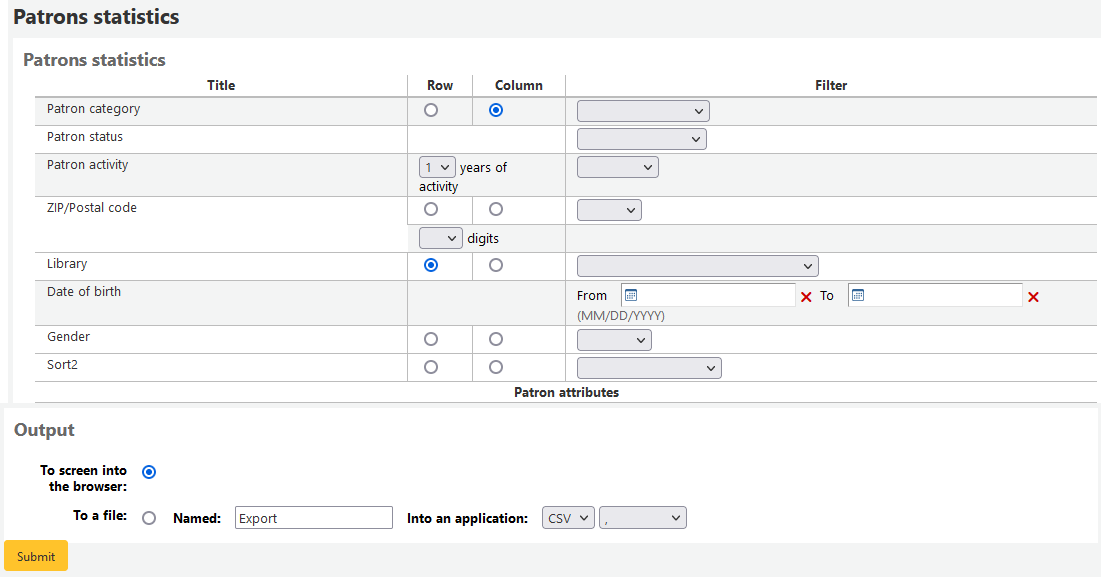
Om du väljer att skicka till webbläsaren kommer resultaten att visas på skärmen.
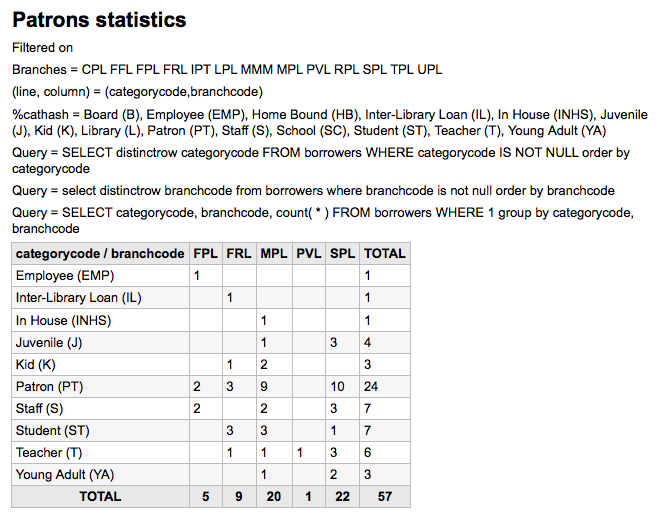
Baserat på dina val, kan du se frågeinformation ovanför resultattabellen. Du kan också välja att exportera till en fil som du kan redigera efter behov.
Katalogstatistik
Obs
These reports are limited in what data they can look at, so it’s often recommended to use custom reports for official end of the year statistics.
Using the form provided, choose which value you would like to appear in the column and which will appear in the row.
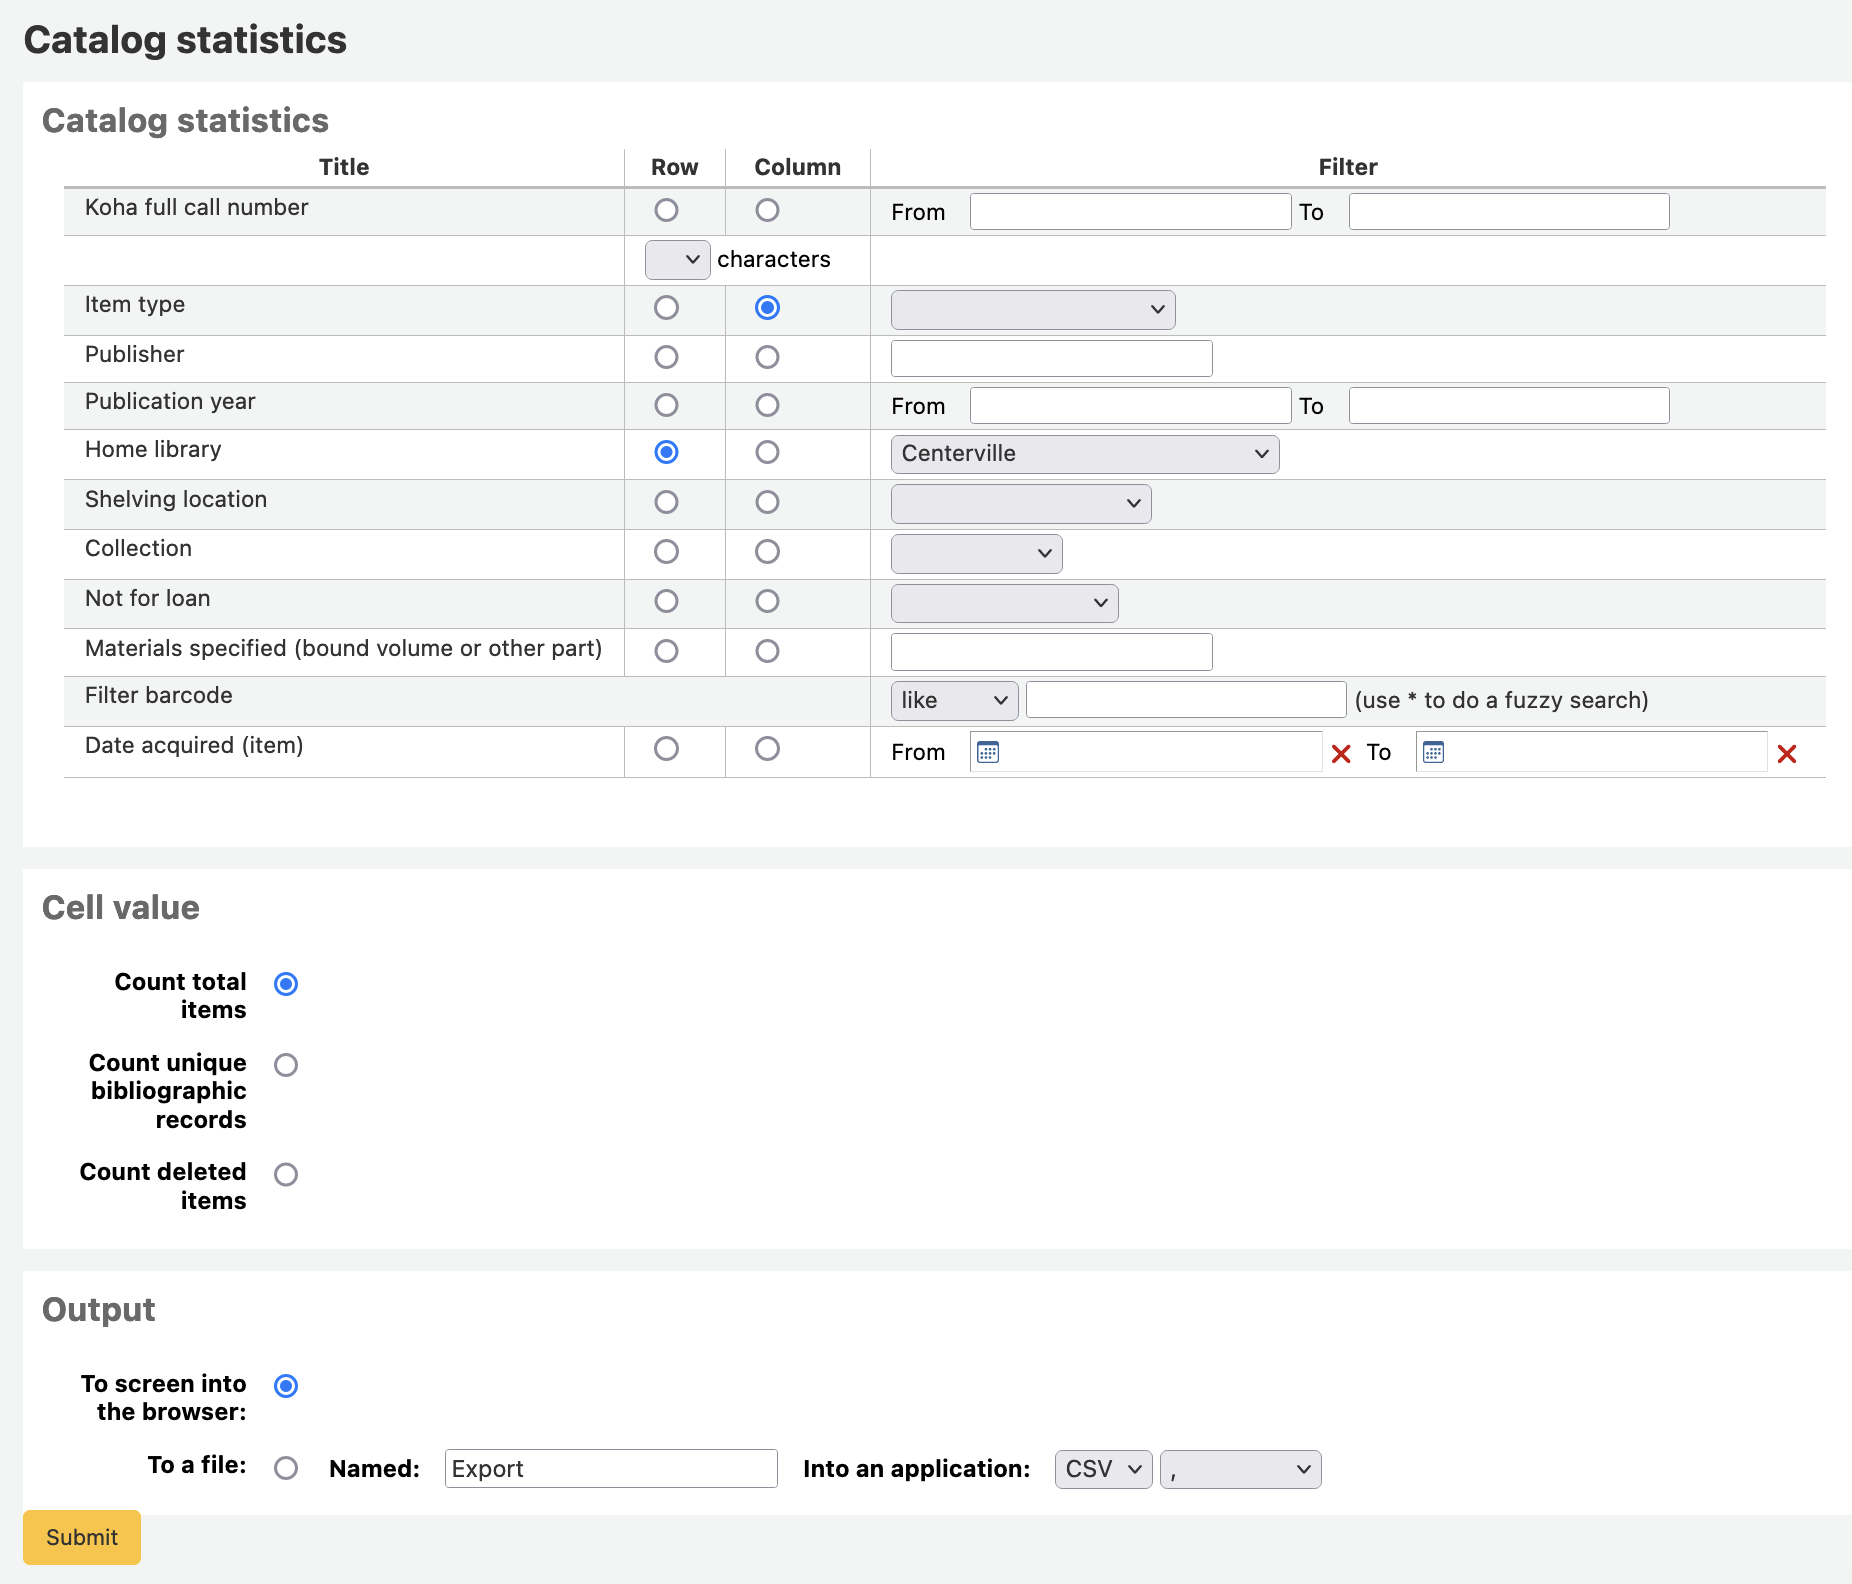
Om du väljer att skicka till webbläsaren kommer resultaten att visas på skärmen.

Du kan även exportera till en fil som du kan bearbeta efter behov.
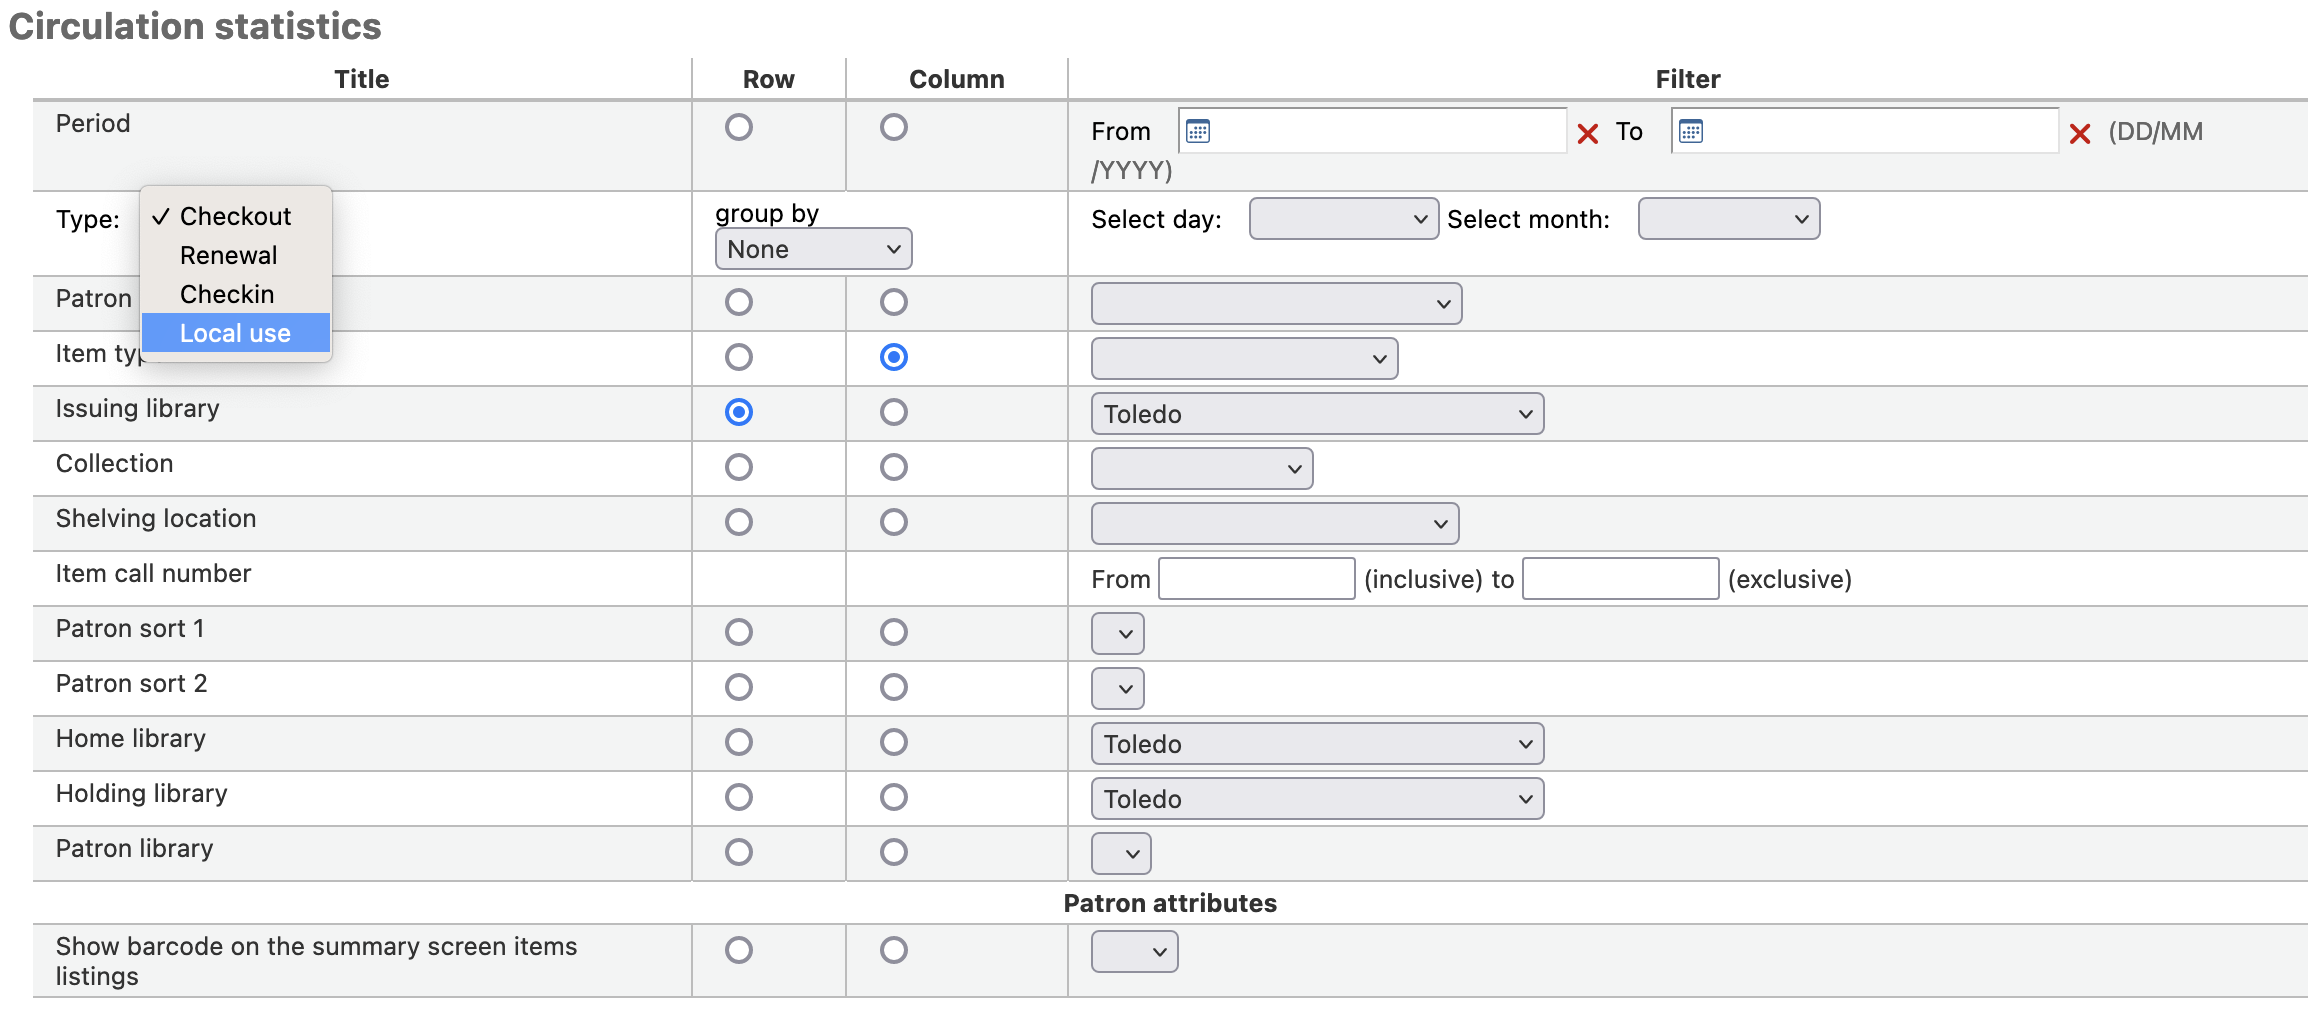
Utlåningsstatistik
Obs
These reports are limited in what data they can look at, so it’s often recommended to use custom reports for official end of the year statistics.
Using the form provided, choose which value you would like to appear in the column and which will appear in the row.
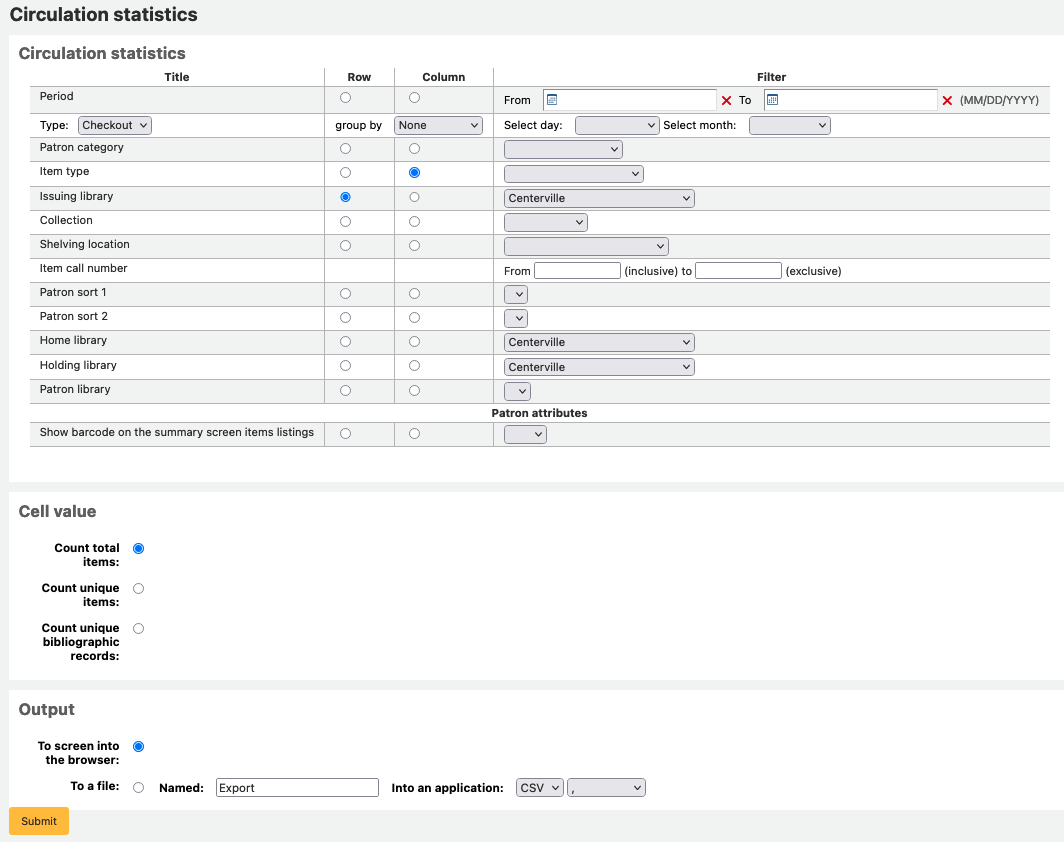
Om du väljer att skicka till webbläsaren kommer resultaten att visas på skärmen.
Du kan även exportera till en fil som du kan bearbeta efter behov.
Obs
To get a complete picture of your monthly or daily circulation, you can run the report twice, once for ’Type’ of ’Checkout’ and again for ’Renewal.’
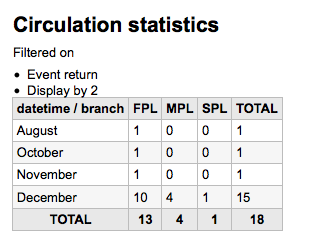
This report uses ’Period,’ or date, filtering that allows you to limit to a month by simply selecting the first day of the first month through the first day of the next month. For example, 10/1 to 11/1 to find statistics for the month of October.
To find daily statistics, set your date range.</br> Example: ”I want circulation data starting with date XXX up to, but not including, date XXX.”
För en hel månad är ett exempel på ett intervall: 11/01/2009 till 12/01/2009
För ett helt år är ett exempel på ett intervall: 01/01/2009 till 01/01/2010
För en enda dag är ett exempel: 11/15/2009 till 11/16/2009 för att hitta det som lånades ut och återlämnades den 15:e
Tracking in house use
Using the Circulation statistics reporting wizard you can run reports on in house usage of items simply by choosing ’Local use’ from the ’Type’ pull down:
Periodikastatistik
Obs
These reports are limited in what data they can look at, so it’s often recommended to use custom reports for official end of the year statistics.
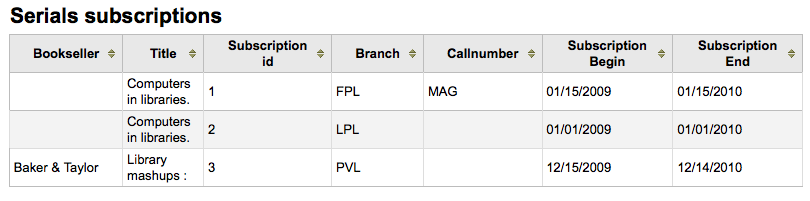
I formuläret väljer du hur du vill lista periodika i ditt system.
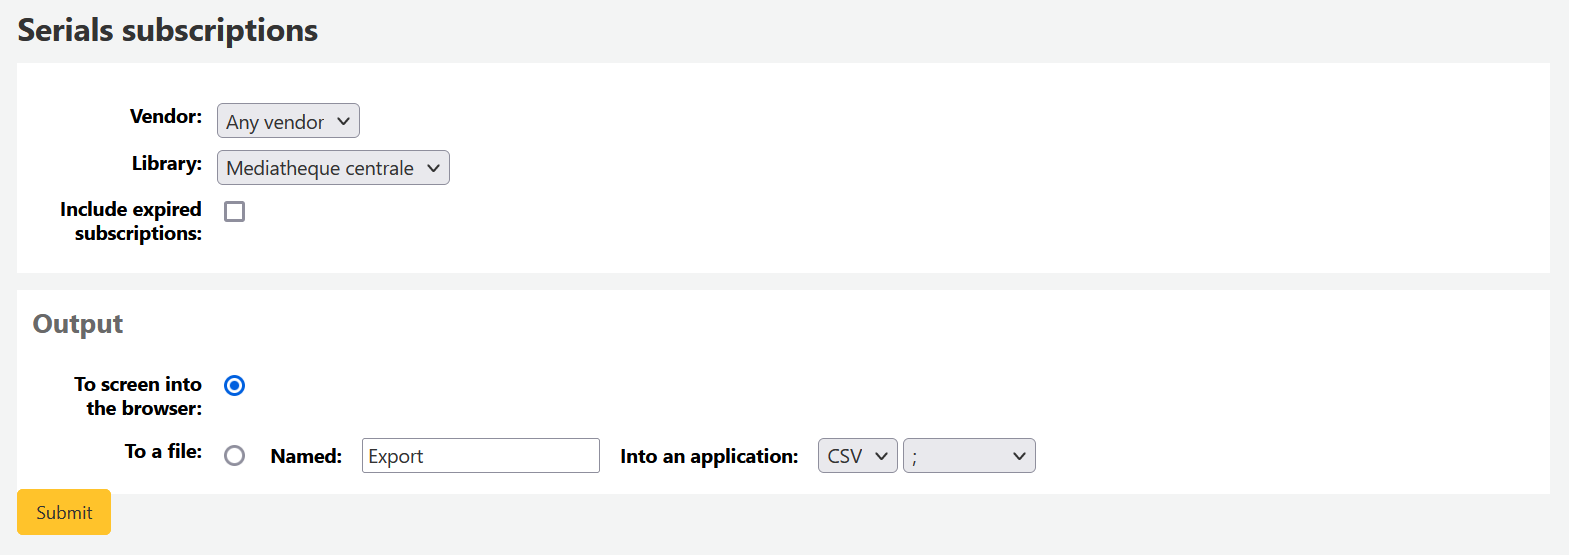
Om du väljer att skicka till webbläsaren kommer resultaten att visas på skärmen.
Du kan även exportera till en fil som du kan bearbeta efter behov.
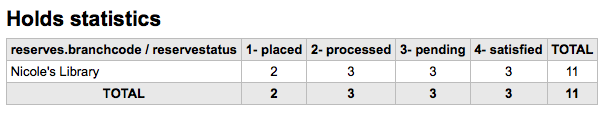
Reservationsstatistik
Obs
These reports are limited in what data they can look at, so it’s often recommended to use custom reports for official end of the year statistics.
I formuläret kan du se statistik för reservationer, slutförda reservationer, annullerade reservationer och annat för ditt bibliotek. I formuläret väljer du värdet du vill visa i kolumnen och vilket värde som ska visas på raden. Du kan också välja från filtren längst till höger i formuläret.
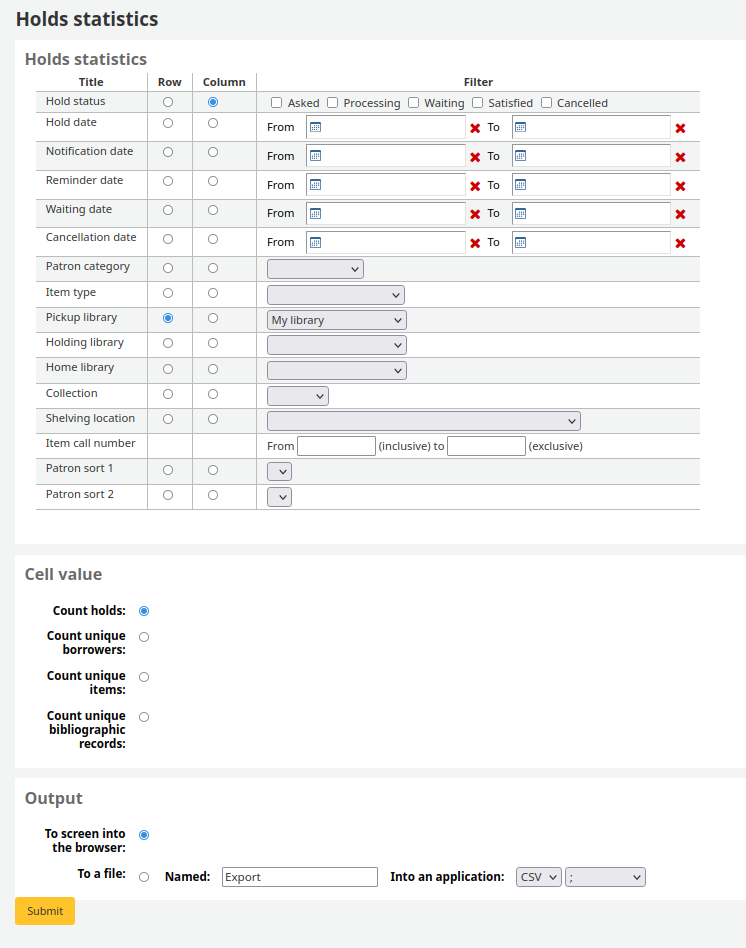
Om du väljer att skicka till webbläsaren kommer resultaten att visas på skärmen.
Du kan även exportera till en fil som du kan bearbeta efter behov.
Låntagare med flest lån
Denna rapport listar helt enkelt bara de låntagare som lånat mest.
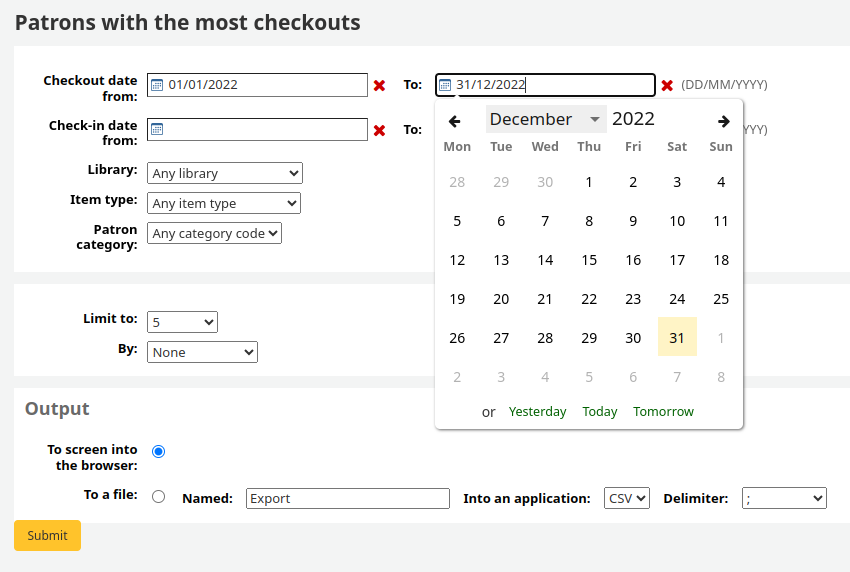
Om du väljer att skicka till webbläsaren kommer resultaten att visas på skärmen.
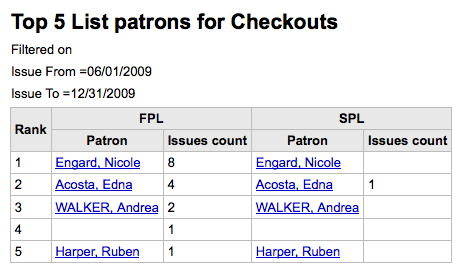
Du kan även exportera till en fil som du kan bearbeta efter behov.
Mest utlånade exemplar
Denna rapport listar helt enkelt bara de exemplar som lånats ut mest.
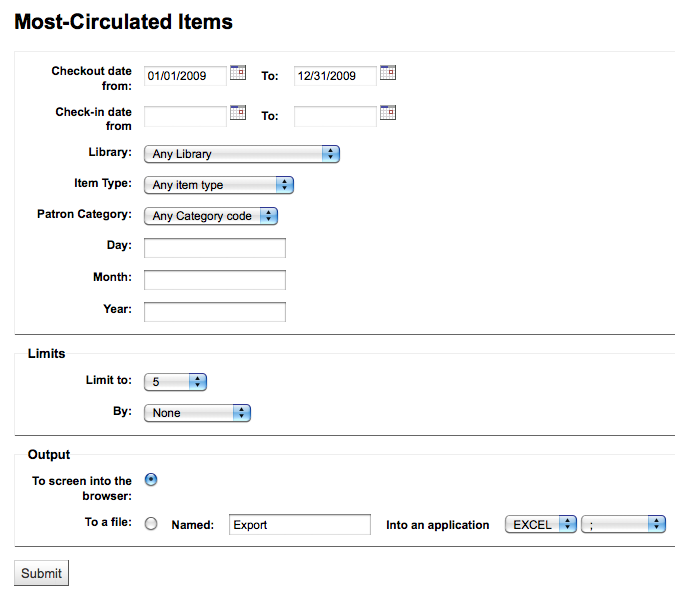
Om du väljer att skicka till webbläsaren kommer resultaten att visas på skärmen.
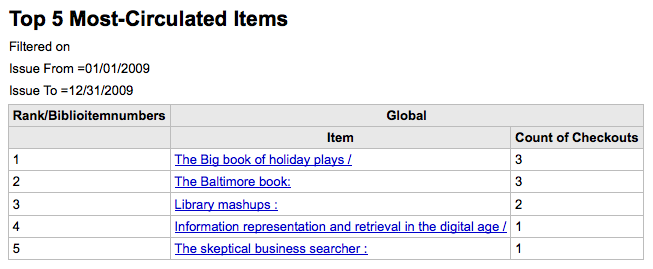
Du kan även exportera till en fil som du kan bearbeta efter behov.
Låntagare som inte lånat
Denna rapport listar de låntagare i ditt system som inte lånat några exemplar.
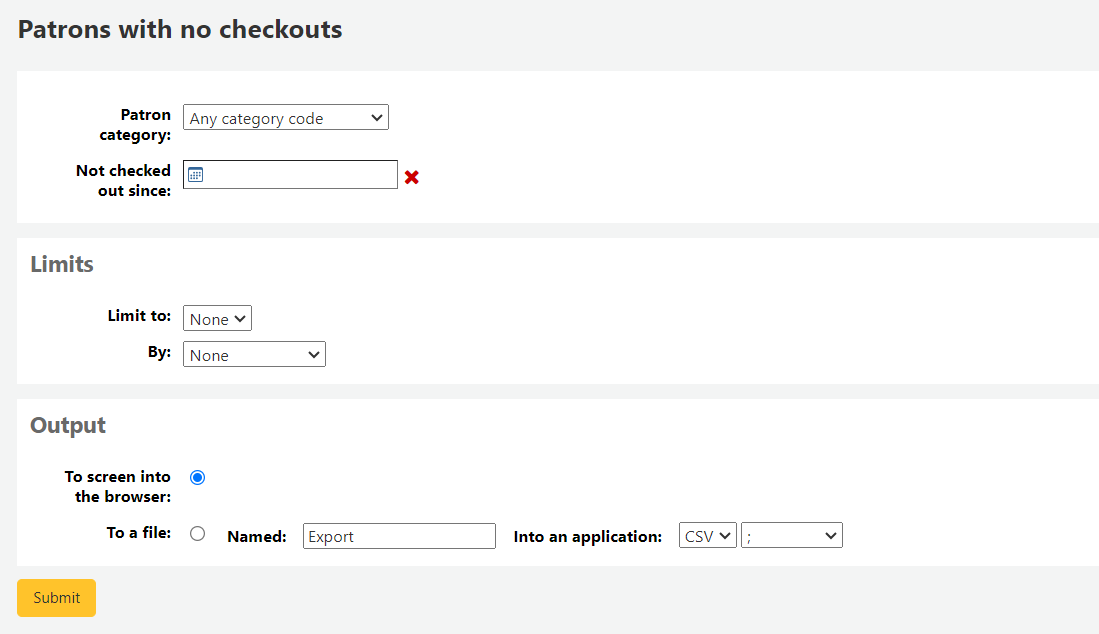
Om du väljer att skicka till webbläsaren kommer resultaten att visas på skärmen.
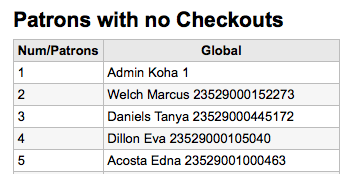
Du kan även exportera till en fil som du kan bearbeta efter behov.
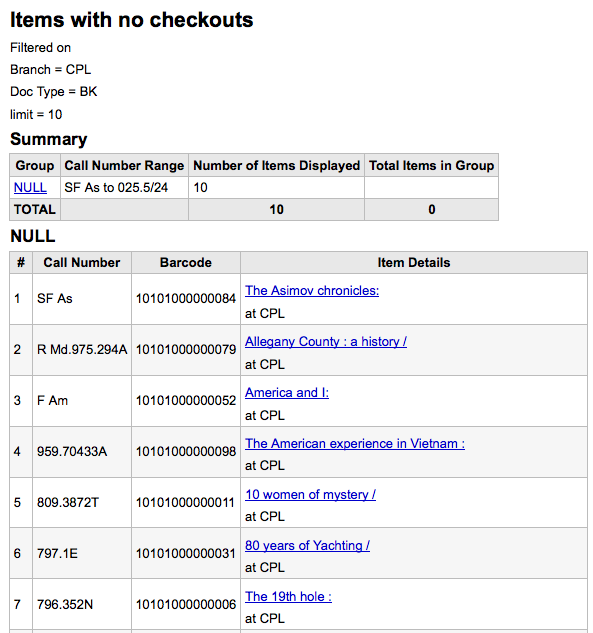
Exemplar utan lån
Denna rapport listar exemplar i din samling som aldrig lånats ut.
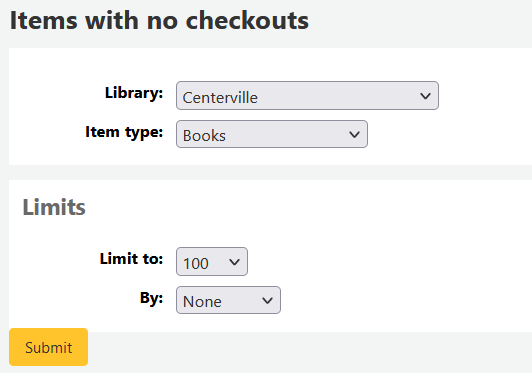
Om du väljer att skicka till webbläsaren kommer resultaten att visas på skärmen.
Du kan även exportera till en fil som du kan bearbeta efter behov.
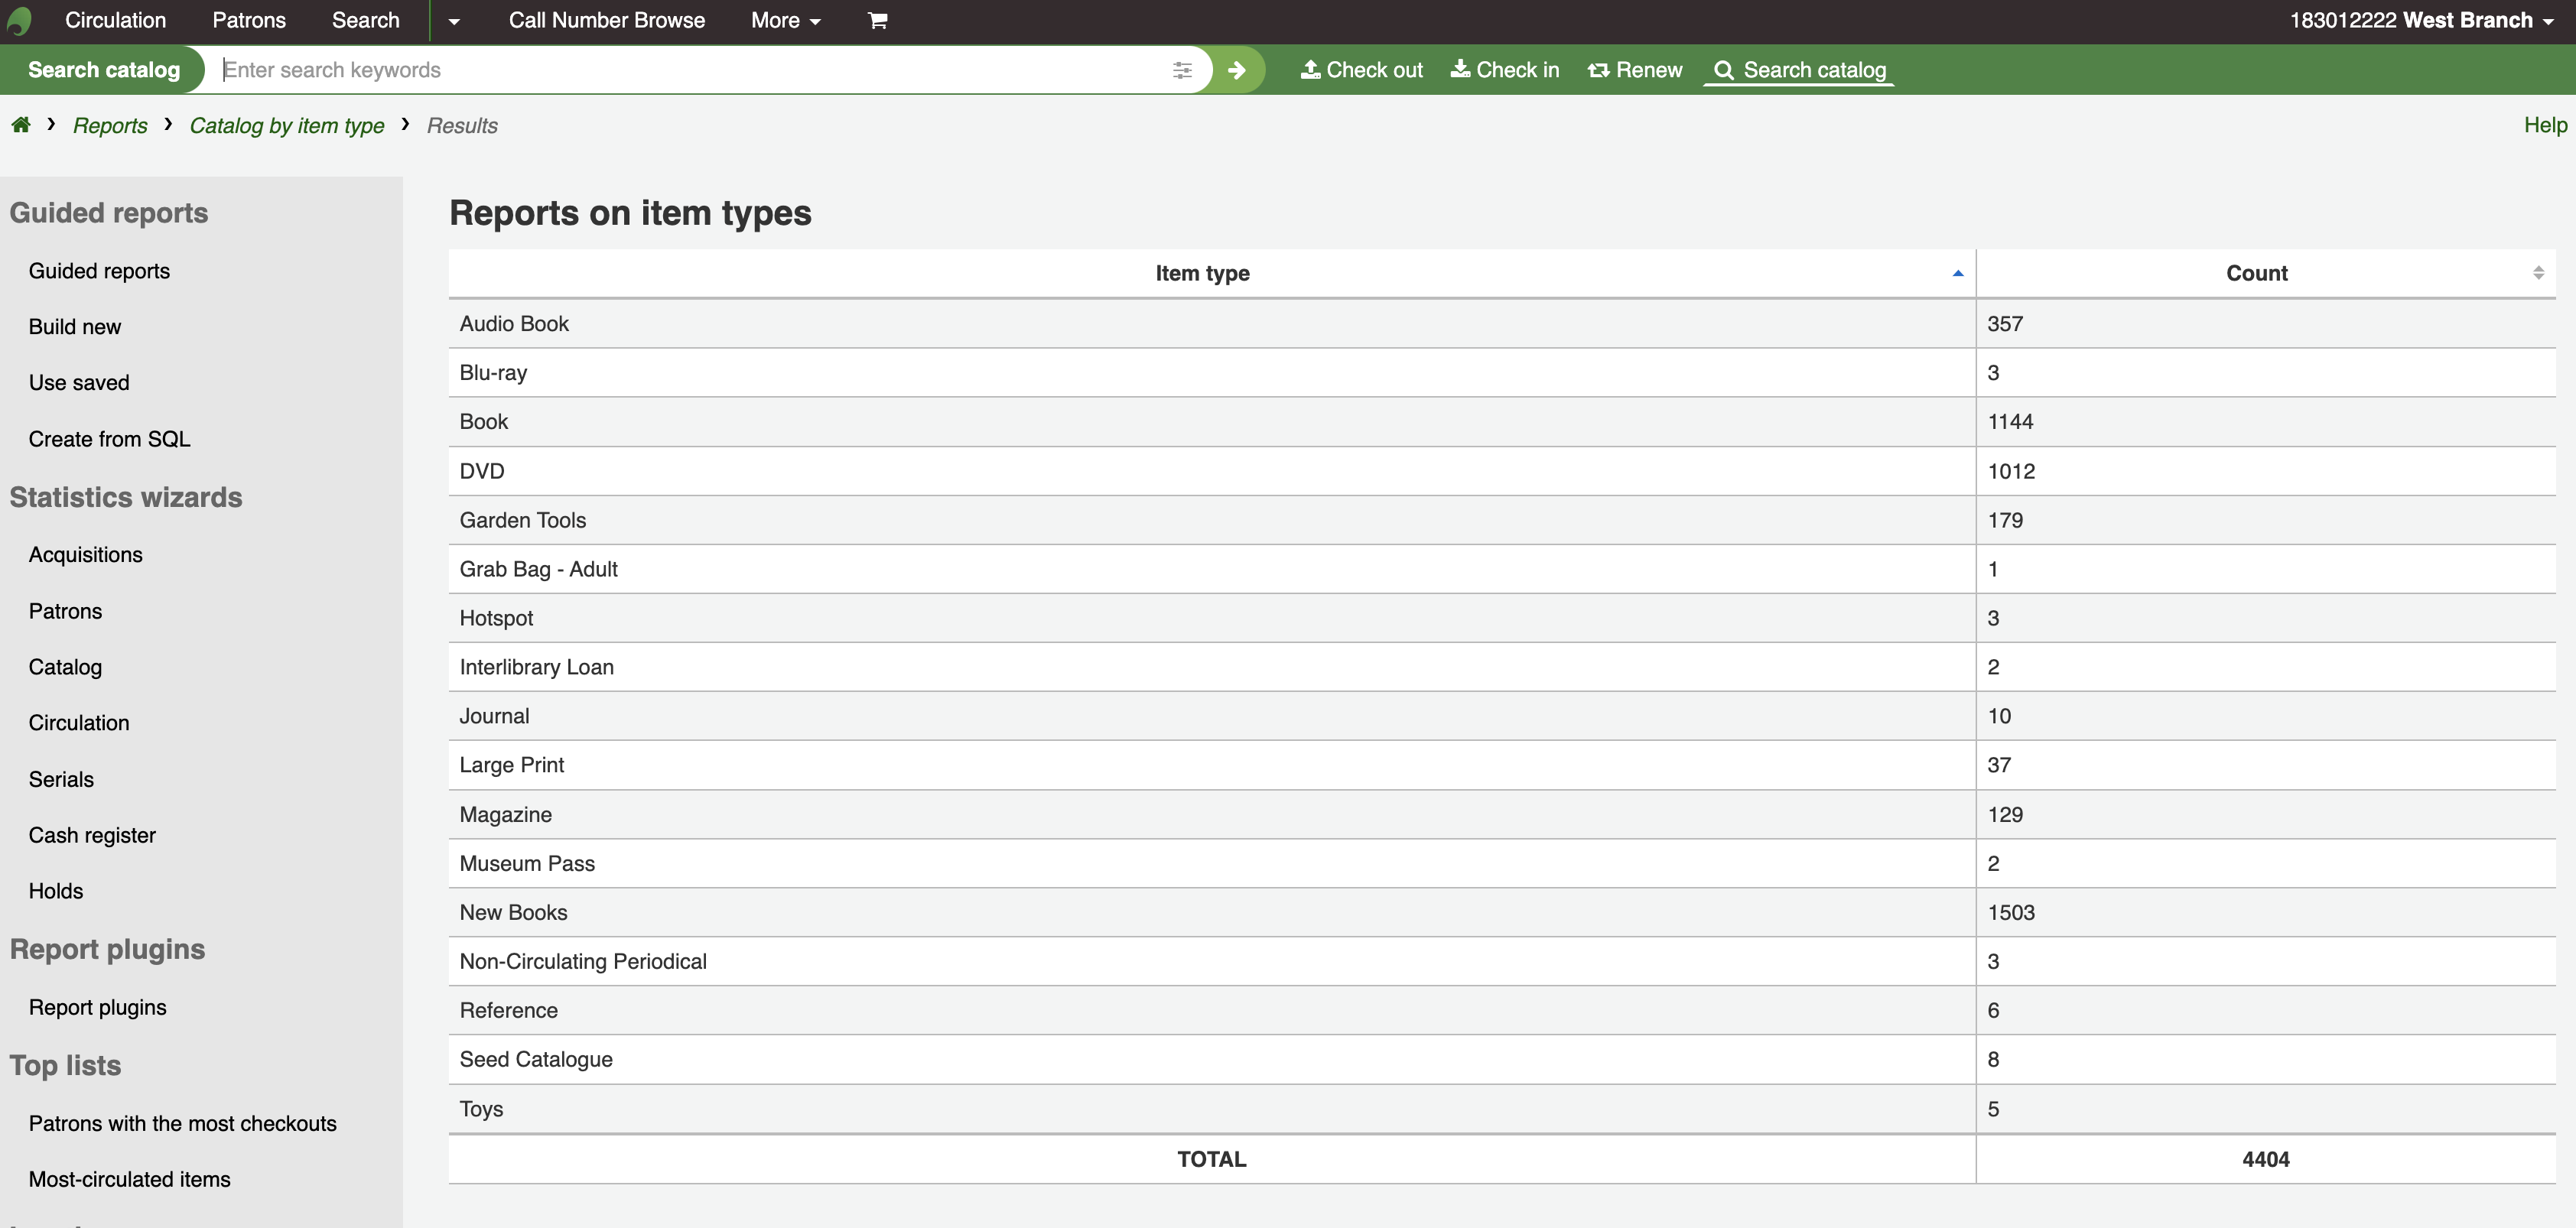
Katalog per exemplartyp
This report will list the total number of items of each item type per branch.
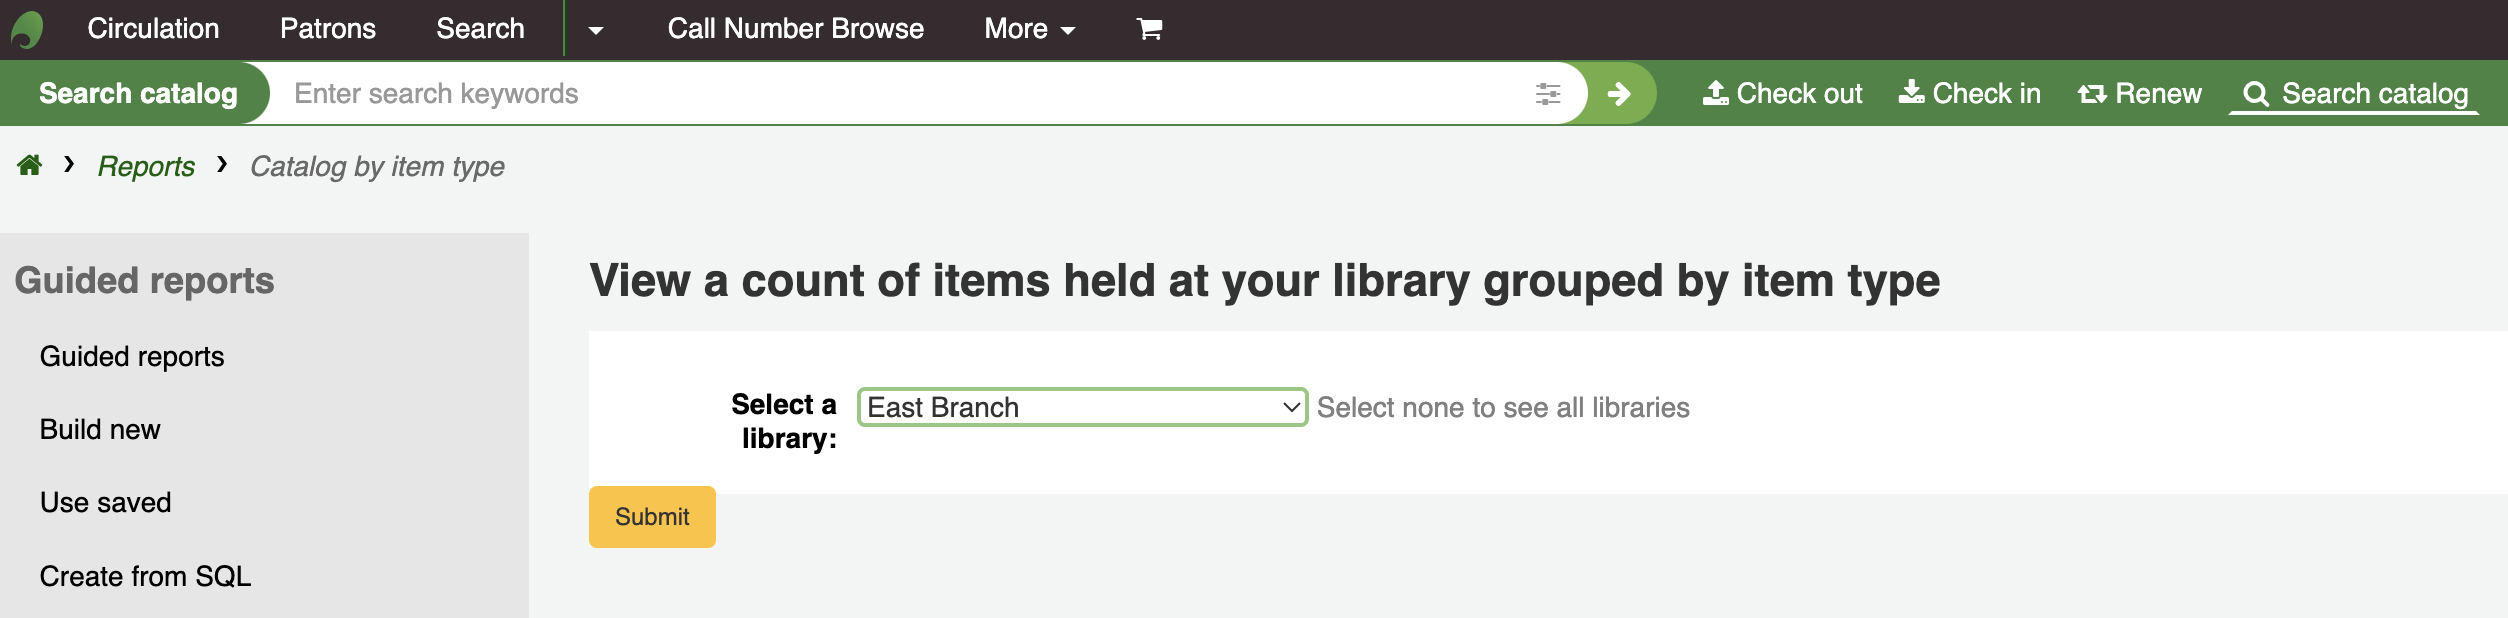
Om du väljer att skicka till webbläsaren kommer resultaten att visas på skärmen.
Du kan även exportera till en fil som du kan bearbeta efter behov.
Förlorade exemplar
This report will allow you to generate a list of items that have been marked as Lost within the system
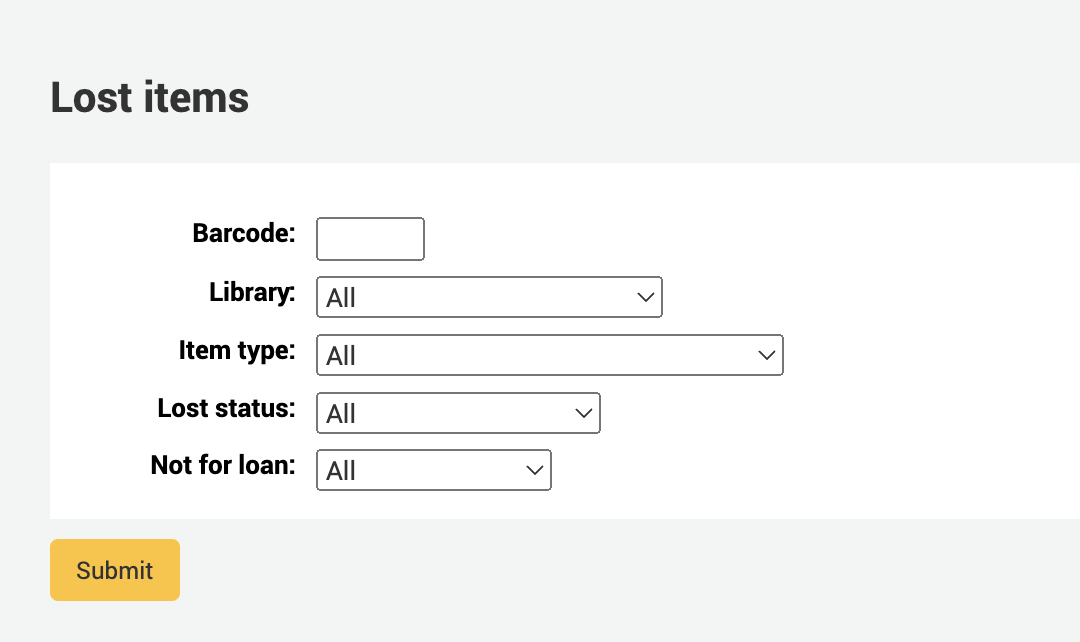
Once you have chosen parameters, you will see the corresponding list of items.
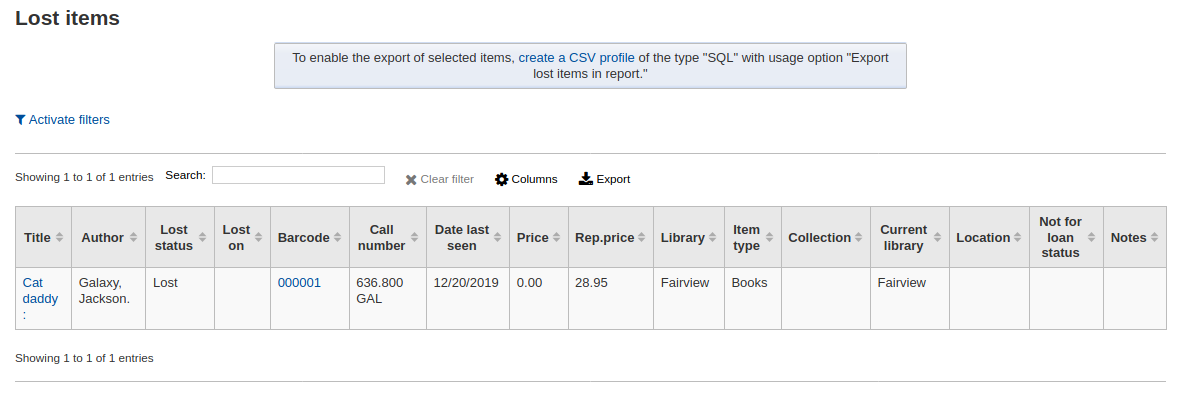
Obs
You can customize the columns of this table in the ’Table settings’ section of the Administration module (table id: lostitems-table).
Orders by fund
If you use the Acquisitions module, you will be able to see all the items that were ordered in each fund.
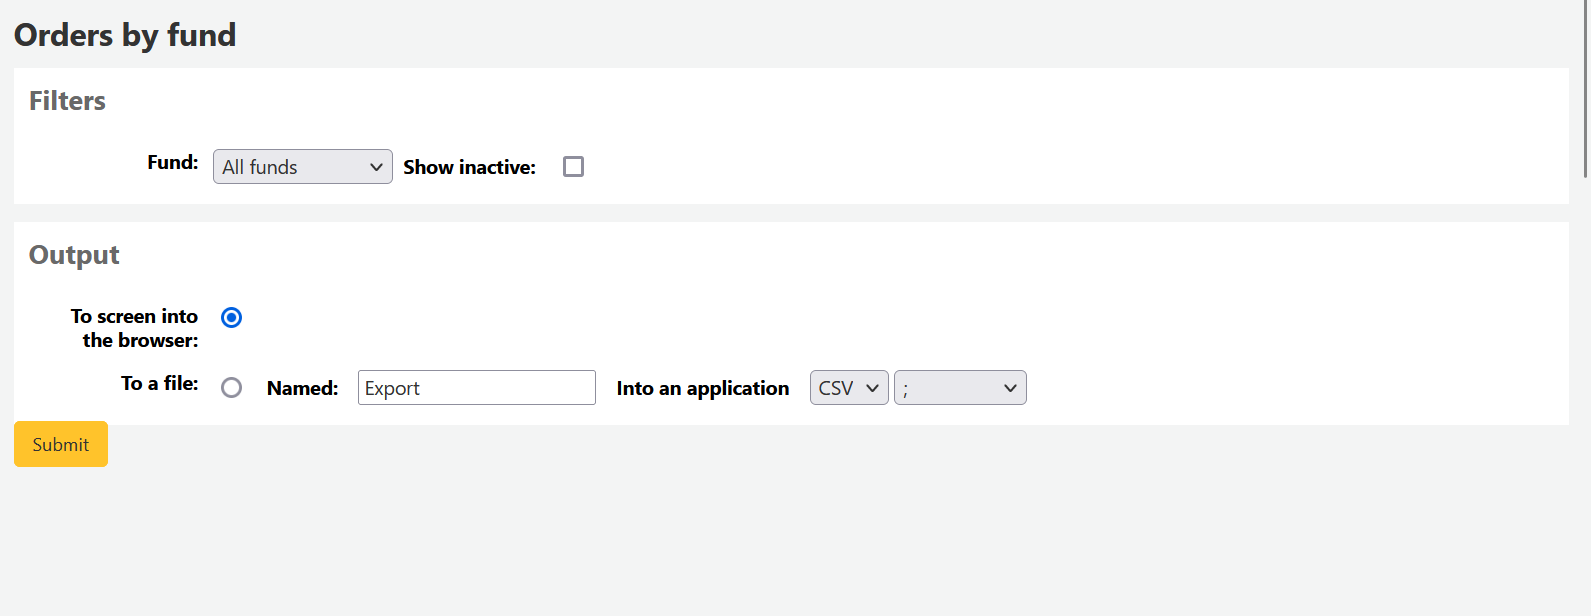
Once you choose the fund you wish to view, you can export the results or view them in the browser. If you choose to view them directly, you will be shown the list of orders.
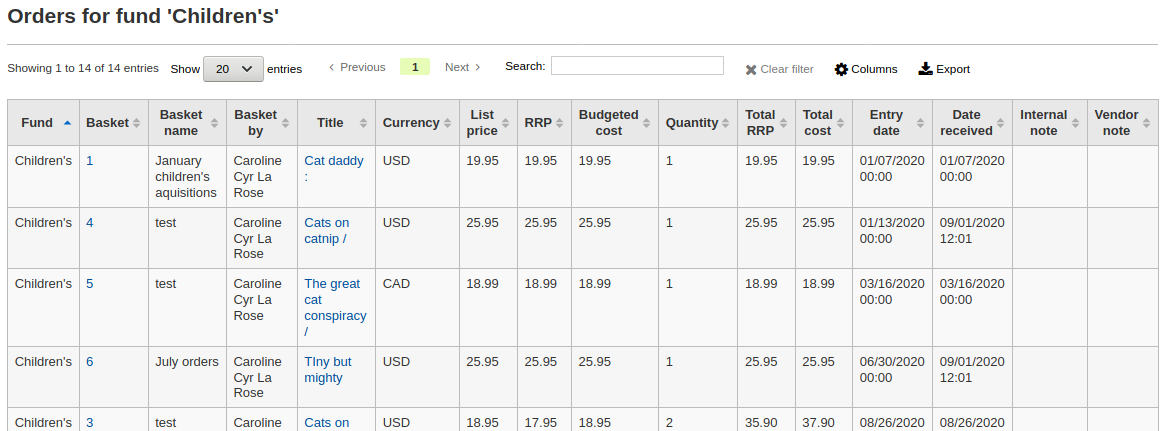
Obs
You can customize the columns of this table in the ’Table settings’ section of the Administration module (table id: funds-table).
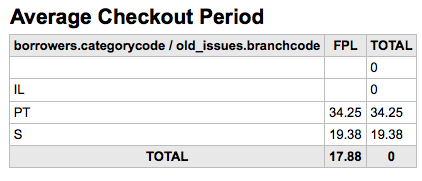
Genomsnittlig lånetid
This report will list the average time items are out on loan based on the criteria you enter:
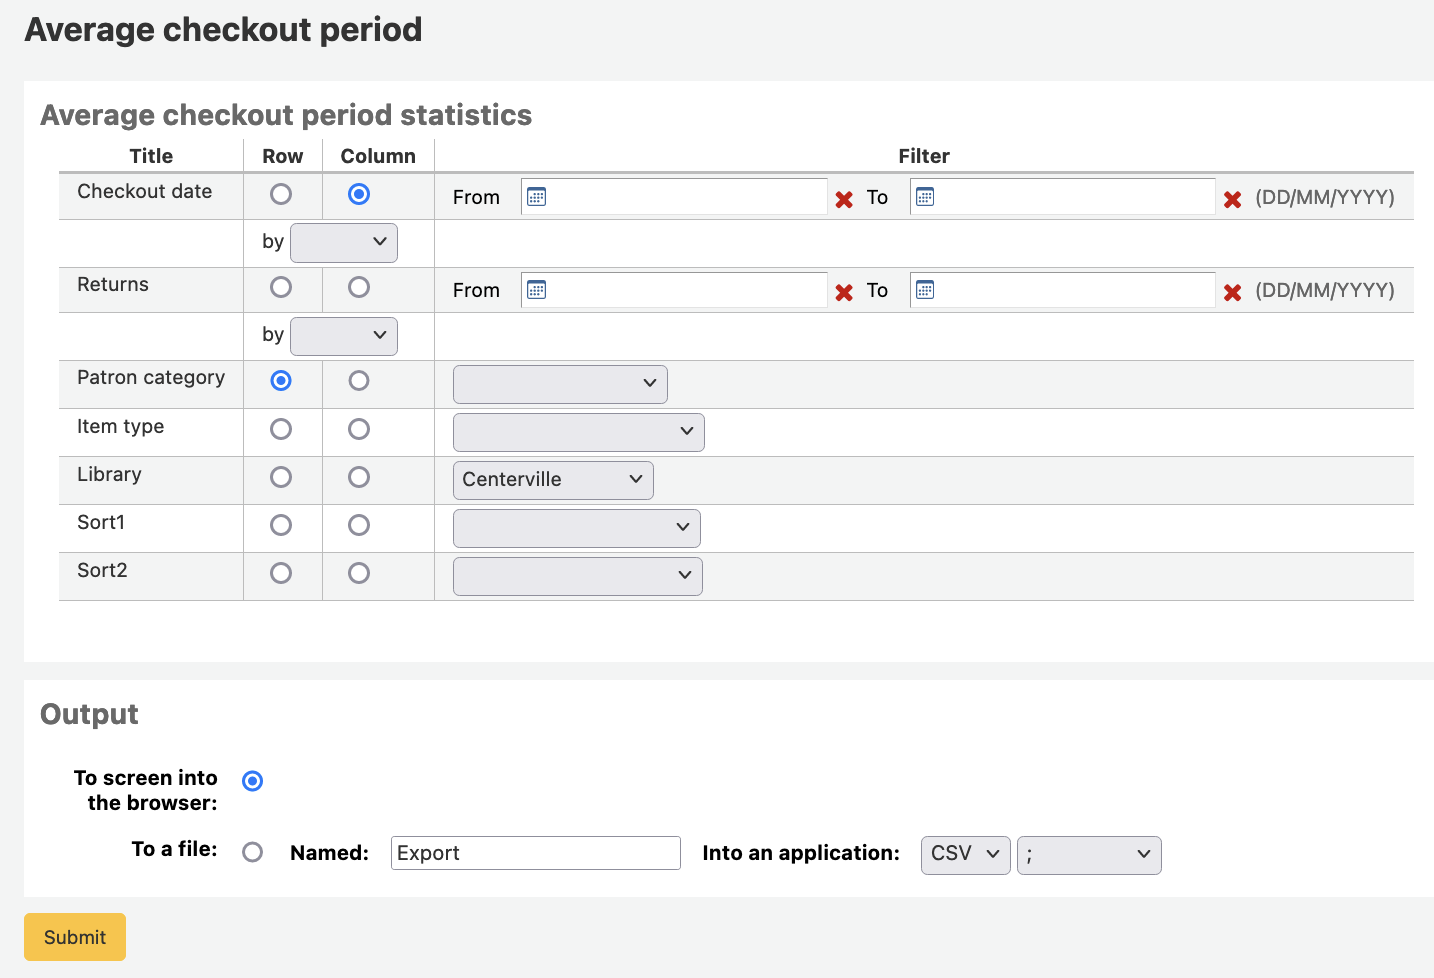
Om du väljer att skicka till webbläsaren kommer resultaten att visas på skärmen.
Du kan även exportera till en fil som du kan bearbeta efter behov.
Report dictionary
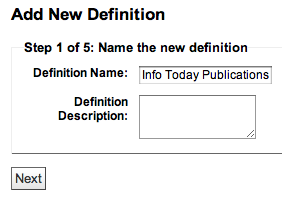
The report dictionary is a way to pre-define common filters you’d like to apply to your reports. This is a good way to add in filters that the report wizard doesn’t include by default. To add a new definition, or filter, click ’New definition’ on the reports dictionary page and follow the 4 step process.
Steg 1: ge definitionen ett namn och ange en beskrivning om det behövs
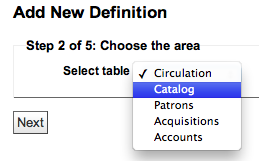
Steg 2: välj vilken modul frågorna ska ställas mot.
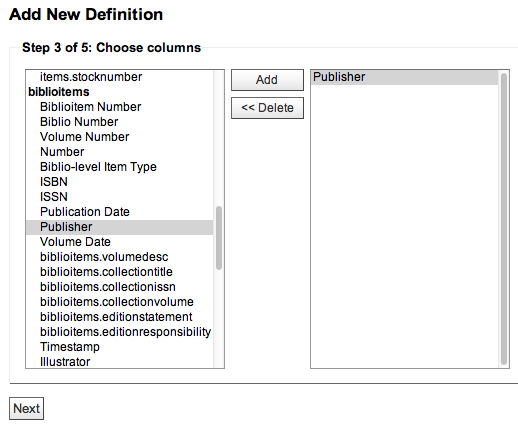
Steg 3: välj kolumnerna du är intresserad av från de visade tabellerna.
Steg 4: välj värden från fälten. Dessa kommer automatiskt att fyllas i med alternativ från din databas.
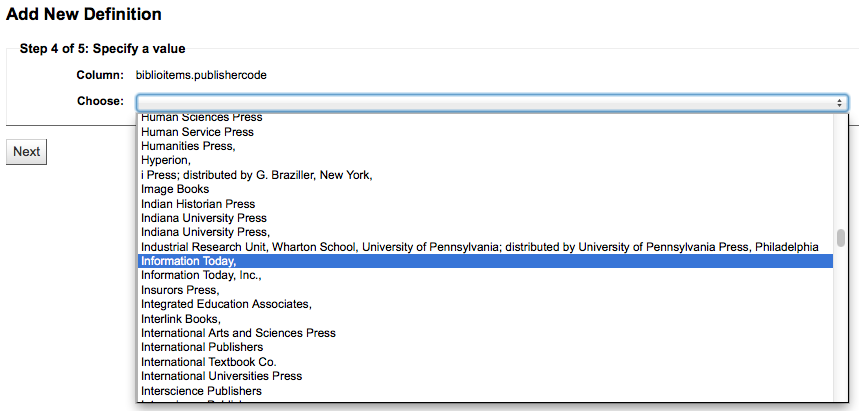
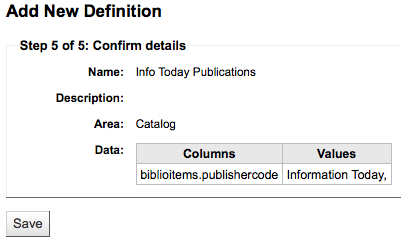
Bekräfta dina val för att spara definitionen.
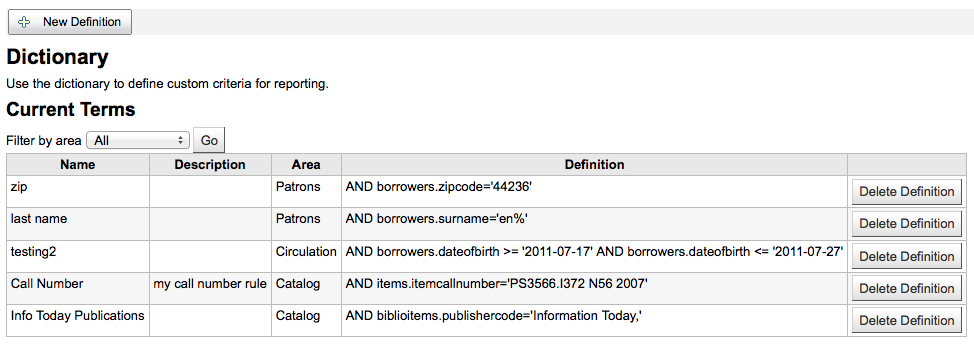
Dina definitioner kommer att visas på sidan Fördefinierade rapportfilter
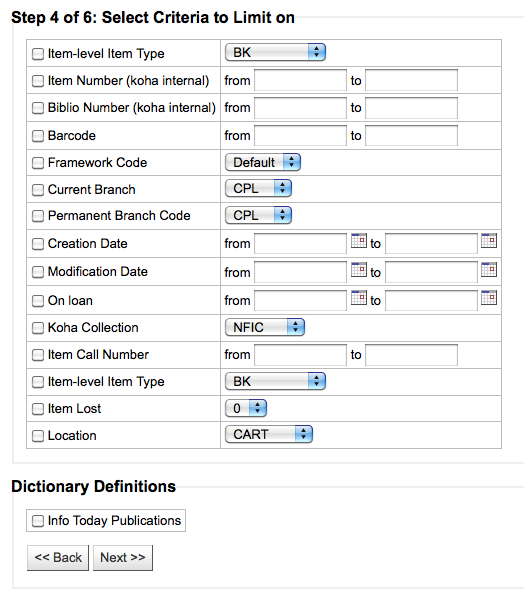
När du sedan genererar rapporter för modulen för vilken du skapade värdet, kommer du att se ett alternativ att begränsa på definitionen längst ner, under de vanliga filtren.
Report plugins
Some plugins that are available can be used to make or enhance reports.
Get there: More > Reports > Report plugins > Report plugins
Observera
Only staff with the report permission (or the superlibrarian permission) will be able to access report plugins.
From this page, you will see only report-type plugins.
See the managing plugins section of this manual to learn how to manage your report-type plugins.